InvestPub - Leveraging Volatility - My Best Strategy for Todays Markets

This eBook is all about how to take advantage of volatility.

You can begin reading simply by scrolling down.

But we wanted to let you know some AWESOME news - As part of this eBook, we've secured free access to an incredible workshop called "16 Hour Jump Trades" which shows you how to capture massive moves in all market conditions.

Simply click the button below to attend the session at no cost...

Access the Workshop

Chapter
01

Experience Explosive Growth with 16-Hour Jump Trades

By Roger Scott, WealthPress.com

What would you do with an extra $8,830per month...EVERY month?

How would that affect your life? Would you pay off your mortgage faster? Pay for your child's college education? Buy that exotic car you always wanted?

Join legendary traders Roger Scott and Rob Booker as they walk you through a brand new strategy that gives you advanced notice of potentially explosive trades with 16 hours of advance notice.

So, you have 16 hours advance notice before you place your trade. No more hanging looking for trade setups, and these are trades can offer gains of +273%, +426%, and even +883% gains in a matter of days or weeks.

So sit back, and watch Rob Booker and Roger Scott walk you through this brand new strategy.

THE MOVIE: EXPERIENCE EXPLOSIVE GROWTH WITH 16-HOUR JUMP TRADES

ABOUT THE AUTHOR

Author: Roger Scott, Founder
Company: Wealth Press
Website: WealthPress.com
Services Offered: Trading Courses, Mentorship,
Markets Covered: Stocks, Options, Futures, Forex

WealthPress is widely known for providing traders around the world with the very best in short-term and day trading methodologies.

How to Legendary Traders Capture their Biggest Wins

[pic of Rob and Roger if we have one] Want to see how these geniuses grab
gains like 426%... 780% .. and 883% like clockwork?

Access the Free Workshop Here

Chapter
02

How to Trade Butterflies to Beat Any Market

By Larry Gaines, PowerCycleTrading.com

Butterflies provide a low risk high reward trading opportunity. Markets direction can go through months, and even years of higher than usual uncertainty. Technical analysis may be painting one picture, while the economic or political environment is painting another. This can be both stressful and costly. The Butterfly strategy offers a solution to this dilemma that all traders face on a regular basis. 

While there’s always some degree of uncertainty that traders and investors must accept, there can be long frustrating periods of higher than usual conflicting signals. This increases risk for traders and investors. Yet, waiting on the sidelines has opportunity costs. For traders who have come to rely on regular income from trading, loss of that income can cause serious lifestyle problems. These situations call for a strategy that will work no matter which direction the market heads.

That’s exactly what the highly versatile Butterfly strategy does. It gives you a trading advantage in any type of market environment. This makes it a powerful strategy that every serious trader will want to add to their arsenal of skills.

Many traders know of the advantages of the Butterfly, yet they may have avoided it because of its complexity. Initially, the setup can seem overly complicated. This is because most traders try to master the Butterfly without truly understanding a few basic option trading principles first.

In this presentation, I’m going to simplify the Butterfly for you. The reality is that once you grasp these basic concepts, you’ll see that the Butterfly is just marrying a couple of simple setups that you probably already know. Serious traders take the time to master the skills to increase their returns while lowering their risk. The Butterfly is one powerful way to do that. Since many traders avoid the Butterfly, by taking time to master it is going to give you a powerful edge up on traders who continue to avoid it.

Here is what you’ll learn

  1. Best Market Conditions for Butterflies
  2. Benefits of Butterflies
  3. The Option Greeks You Need to Know First
  4. The Most Important Option Factor         
  5. The Butterfly Setup

I. Best Market Conditions for Butterflies

Unlike other option strategies such as iron condors, credit spreads, or debit spreads that only work with an identified objective based on probable market direction, Butterflies can be set up and traded for a variety of objectives based on where a trader thinks the security or market is headed, as outlined below. One of the best things about Butterflies is that they are ideal regardless of market direction!

1. You Just Don’t Have Any Idea Where the Market is Headed

Non-Directional – Here’s the real beauty of the Butterfly! In their simplest form, butterflies can be delta neutral or non-directional trades. This means they can be used successfully when you simply DO NOT KNOW the market direction. Trying to pick the direction of stocks or the overall market can be stressful and expensive. Delta neutral butterflies can be set up to take the guesswork out of trading.

2. You Feel Pretty Sure the Market Is Headed Up or Down

Directional – The Directional Butterfly Spread can also be used for bullish or bearish exposure to the market while also managing risk and retaining large potential returns.

There’s no such thing as a free lunch: Butterfly spreads cannot offer unlimited profit potential. But they usually cost less than buying options outright while providing a powerful positive risk reward trade set-up that simply cannot be found with other trading strategies. 

3. You Don’t Want to Lose Your Shirt!

Hedging – The Directional Butterfly can be used as a fast to execute hedge on positions that are moving against you. This is exactly what the most sophisticated companies do. They hedge, and so can individual traders! Note: This lowers trading stress!

Constructing a butterfly around a strike that is under pressure from another core trade (such as a credit spread, or debit spread) controls risk.

This allows you to keep the original position open, buying time. Often, additional time is all that’s needed for a trade to move back to profit territory. At that point you can then remove the butterfly hedge and stick with your original trade.

Butterflies provide cheap protection! Many longer-term investors and swing traders buy puts for portfolio insurance. Long term out-of-the-money put butterflies, however, can be a much cheaper method of portfolio protection than pure long puts.

II. Benefits of Butterflies:

Income - Butterflies can be used to generate income from stocks that appear to be going nowhere in the short term. This alleviates overall portfolio returns in flat markets.

Low Cost - Butterflies can best structured and traded at a very low cost.

Risk Reward - A 10-to-1 or higher Reward-to-Risk is common. This fantastic risk reward ratio makes them well worth the effort to learn the structure.

Low Maintenance – Butterflies are sometimes called “vacation trades” due to their low risk and need for only very infrequent monitoring.

  • Butterfly trades are generally very slow moving early on in the trade.
  • But get more exciting and volatile as they approach expiration and are within the profit tent (Zone).

III. The Option Greeks You Need to Know First

The "Greeks" provide a way to measure the sensitivity of an option's price to quantifiable factors. The Greeks are strictly theoretical. That means the values are projected based on mathematical models and all of the best commercial options-analysis packages will do this, and on some of the better brokerage sites they are free.

Brief Review of the Greeks

Theta – (decay movement) measures your time decay (per day) – increases each day as it gets nearer EXP. & at zero at EXP.

Implied Volatility – (price movement) what the marketplace is “implying” the volatility of a stock will be in the future & its effect on where price will be

Delta – (price movement) measures the change per $1 change in the underlying & a measure of price probability

Vega – (volatility movement) measures the change per 1% change in volatility, decreases each day & at zero at EXP.

Gamma – (price movement) is the rate of acceleration of delta based on a $1 change in the underlying – most at risk & largest impact last week of EXP.

IV. The Most Important Option Factor

The most important option factor for profit generation using the Butterfly Strategy comes down to understanding the concept of TIME, and its effect on the price of an option…

Time Value ~ is used for trading strategies that take advantage of the accelerated Time Decay of an option into its Expiration. Butterfly Strategies are tied to Time Value (Theta) & the impact it has on the price of an option.

What exactly is Time Value?

Time value (TV) (extrinsic) of an option is the premium a rational investor would pay over its current exercise value (intrinsic value), based on its potential to increase in value before expiring. This probability is always greater than zero, thus an option is always worth more than its current exercise value. The change in the value of an option, based on Time Decay, can be measured using the Greek, Theta…

Option Theta

Theta tells you how much an option’s price will diminish over time, which is the rate of time decay of a stock’s option.

Time decay occurs because the extrinsic value, or the Time Value, of options diminishes as expiration draws nearer.

By expiration, options have no extrinsic value and all Out of the Money (OTM) Option expire worthless.

The rate of this daily decay all the way up to its expiration is estimated by the Options Theta Value.

Understanding Option Theta is extremely important for the application of option strategies that seeks to profit from time decay. 

Options Theta – Characteristics

Option Theta values are either positive or negative.

All long stock option positions have negative Theta values, which indicates that they lose value as expiration draws nearer.

All short stock option positions have positive Theta values, which indicates that the position is gaining value as expiration draws nearer. 

Theta value is highest for At the Money (ATM) Options

And progressively lower for In-The Money (ITM) and Out-of-The Money (OTM) options.

ITM and OTM options have much lower extrinsic values, giving little left to the decay.

For Example:

An option contract with Option Theta of -0.10 will lose $10 per contract every day even on weekends and market holidays.

The buyer/holder of an option contract over a 3-day long weekend with a price of $1.40 or $140 per option contract and an option theta of -.10 will find the price of that option at $110 instead of $140 after the 3-day weekend.

Theta Decay Strikes!

Option theta does not remain stagnant.

It increases as expiration draws nearer and decreases as the options go more and more In-The-Money or Out-of-The Money.

In fact, the effects of Option Theta decay are most pronounced during the final 30 days to expiration where theta soars. 

Take a look at the following chart to see just how predictable and powerful this option paradigm is!

How Option Pricing Works

How to value an option

Time Value (x) Implied Volatility (x) Intrinsic/Extrinsic Value

Note: Once you know these variables then you are ready to price an option & know what its option premium should be.

V. The Butterfly Setup

Butterfly Foundation: Vertical Debit & Vertical Credit Spread

Vertical Debit Spread:

A “bull call” spread, entails buying one call and selling a higher-strike call that will be lower in price to offset some of the premium cost & theta decay

A “bear put” spread entails buying one put and selling a lower strike put, that will be lower in price to offset some of the premium cost & theta decay

These spreads are done for a debit

Vertical Credit Spread:

A “bear call” spreadentails selling one call and buying a higher-strike call that will be higher in price to hedge the short call.  Premium collection.

A “bull put” spread, entails selling one put and buying a lower strike put that will be lower in price to hedge the short put.  Premium collection.

These spreads are done for a credit

Vertical Bull Call Debit Spread

Vertical Bear Call Credit Spread

Selecting the Right Butterfly Option Strategy

One major goal of every trader should be to select trades based on what provides the most consistent positive return with low, defined risk. Not always the greatest return.

And one of the best ways to achieve this is by knowing the Option Butterfly Strategies that are available, how they work and then selecting the one that is best suited for the market environment you are trading.

Butterfly Strategies

  • Long Call or Put Butterfly
  • Short Call or Put Butterfly
  • Broken Wing Call or Put Butterfly
  • Unbalanced-Ratio Butterfly
  • Broken Wing Unbalanced-Ratio Butterfly
  • Directional Butterfly
  • Iron Butterfly
  • Hedging – Defenses Using Butterflies

The Butterfly Foundation = The Balanced Butterfly

         Long Call or Put Butterfly Spread

  • It’s a combination of a bull call debit spread, and a bear call credit spread
  • It is a limited profit, limited risk options strategy
  • There are 3 striking prices involved in a butterfly spread and it can be constructed using calls or puts
  • Called a butterfly spread because you are short the body & long the wings
  • Can be used as a neutral or directional option trading strategy
  • Trade results in a small net debit & max risk is the debit paid
  • Due to small net debit, this strategy offers a great risk-to-reward
  • Short Volatility & Theta Strategy
  • A target price pinning strategy

Max Profit

The maximum profit occurs should the underlying stock be at the middle strike or body at expiration.

In that case, the long call with the lower strike would be in-the-money and all the other options would expire worthless.

The profit would be the difference between the lower and middle strike (the wing and the body,) less the premium paid for initiating the position, if any. 

Max Loss

The Maximum loss occurs should the underlying stock be outside the wings at expiration.

If the stock were below the lower strike all the options would expire worthless

If above the upper strike all the options would be exercised and offset, each other for a zero profit. 

In either case the premium paid to initiate the position would be lost.

Balanced Butterfly Spread Example:

Assuming xyz trading at $45 ~ Directional Price Target $43

Buy to Open 1 contract of August $44 Call at $1.06

Sell to Open (2) contracts of August $43 Call at $1.67
Buy to Open 1 contract of August $42 Call at $2.38

Net Debit = ($2.38 + $1.06) - (2x $1.67) x 100 = $10.00 per spread

Profit Calculation of Butterfly Spread:

Maximum Profit = (Middle Strike - Lower Strike - Net Debit) x 100

Assuming xyz closed at $43 at expiration.

Maximum Profit = $43 - $42 - $0.10 = $0.90 x 100 = $90.00 per spread

ROC = $90/$10 = 900% or R: R 9-to-1

Let’s review what was covered in this Presentation on The Option Butterfly:

I. Best Market Conditions for Butterflies

II. Benefits of Butterflies

III. The Option Greeks You Need to Know First

IV. The Most Important Option Factor

V. The Butterfly Setup

THE SPECIAL OFFER

If you would like to learn more about this chart pattern and my other favorites, along with the directional trading tools we use, at Power Cycle Trading then use the link below and you'll receive one month access to our Power Cycle Trading Club free of charge.

Power Cycle Trading Club

Here is what you will receive:

  1. Virtual Trading room – Open from 9:25 AM until 4:15 PM EDT
  2. Daily Market Update Videos for Day Traders and Swing Traders
  3. Live Weekly Q&A with Larry
  4. Trader’s Education Vault
  5. Monthly Award Points - $20 credit for each month of membership. (Credits can be applied to all current or future courses)
  6. 50% Discounts on All Courses & Trading Software

ABOUT THE AUTHOR

Author: Larry Gaines, Founder
Company: Power Cycle Trading
Website: PowerCycleTrading.com
Services Offered: Trading Courses, Bootcamps/Coaching, Custom Indicators
Markets Covered: Stocks, Options, Futures

Larry Gaines has been involved in trading and brokering commodities and financial markets for over thirty years. Today, Larry trades options and futures, where he enjoys teaching others to generate income from trading using a disciplined systematic based on decades of trading experience.

Chapter
03

How to Avoid Choppy Markets

By Dr. Barry Burns, TopDogTrading.com

Most trading methods do make money when trading in perfect trending conditions, but then give back those same profits during periods of consolidation. So if you could learn to avoid consolidating markets, you could profitably trade many sound trading methodologies.

This Special Report from Top Dog Trading is designed to help you avoid choppy markets.

Although most traders spend years seeking new price patterns and indicators to help them know when to get into the market, professional traders spend most of their time working on filters to keep them out of the market!

I’m sure you don’t need me to convince you of that fact and give you a lot of background, statistics and paper-filler, so let’s jump right into the practical stuff.

There are 5 things I’m always watching that help me determine the “condition” of the market. Some apply only to day trading and others apply to swing trading and investing as well.

CONSOLIDATION SIGNAL #1: FLAT 50 SIMPLE MOVING AVERAGE

The teacher of my very first Futures course taught me this. He said as simple as it is, it would be the best thing anyone ever taught me.

When the 50 simple moving average if FLAT, that means the market is flat, and that means your position should be flat!

“If it’s flat, be flat, it’s as simple as that!”

Below is a 2 minute chart of the S&P emini. You can see that when the 50 MA (the red line) goes flat, it’s a clear indication that there is no trend in the market.

The 50 MA will have to be flat for a few bars when the trend is changing. Therefore this rule only applies when it has been flat for an entire cycle (use your favorite oscillator for measuring cycles).

CONSOLIDATION SIGNAL #2: USE TICK CHARTS

Most people use time charts, meaning that each new bar is created after a certain period of time: 2 minutes, 5 minutes, 1 day, etc.

“Tick” charts are charts that create a new bar after a certain number of TRADES are executed. A 100 tick chart starts a new bar whenever 100 trades go through and the 101st trade comes in.

During consolidation, volume tends to drop. Minute charts will continue to form new bars every minute, thus giving you long periods of consolidation on your chart and creating price patterns and indicator patterns you may be tempted to trade.

Tick charts, however, print fewer bars during periods of low volume consolidation because they only print new bars when the designated number of trades are executed through the exchange. Therefore you don’t see as much consolidation on your chart, thus removing some false signals and some temptation!

Below is a comparison of the exact same 2 hour period as it looks on a 2 minute chart and a 500 tick chart of the eminis.

CONSOLIDATION SIGNAL #3: FLAT ADVANCE/DECLINE LINE

One of the indicators you should always be watching, in my never-to-be-humble opinion, is the Advance/Decline line.

This is the difference between the Advancing and Declining issues. There’s one measurement for the NYSE and another for the NASDAQ.

Use whichever one (or both) that relates to the market(s) you trade.

The bottom line on this indicator is simple. Much like the 50 MA, when it goes flat, keep your account flat. It’s an indication that there is no clear direction in the market.

So the market may be trending, but if the Adv/Dec is flat, your “trending” market could change direction or simply go flat at any moment.

For day trading I use a 2 minute chart of the Advance/Decline line.

When I say “flat,” that is a relative term, as it is with the 50 MA. With the 50 MA I’m looking at the angle of the line, but with Adv/Dec I’m plotting price bars and looking for a clear trend of higher highs/ and higher lows.

CONSOLIDATION SIGNAL #4: FLAT UP/DOWN VOLUME

Here’s another one of my favorites, and I don’t know many people who use this. Hint: that’s called an “edge” for you and me!

It’s the up/down volume. It measures the difference between the up volume and the down volume, as opposed to the difference between the number of issues up verses down. Again, it’s available for both the NYSE and the NASDAQ.

The key is to watch the relationship of the bars to the zero line (I draw it in as a horizontal line on my chart).

If the bars simply hover around the zero line, that’s an indication that there isn’t any strong commitment of traders in either direction today, and therefore you may have a choppy, trendless market or a trend that is in place is less likely to continue following through.

Sometimes the Advance/Decline line will be trending, but if the Up/Down Volume is not trending, then be careful! There may be more issues going up than down, but there isn’t volume to support the move!

There’s no commitment of volume in either direction this morning. This indicates “choppy weather conditions” on the sea of trading.

To twist a quote out of context: You don’t have to be a ‘rocket surgeon’ to figure out what the low-risk trading direction is during this volume activity!

CONSOLIDATION SIGNAL #5: INTER-MARKET BIFURCATION

The final sign of a potentially choppy market is when the major indices get out of alignment.

If you’re trading the DOW, or a DOW stock, and it’s trending up nicely, but the NASDAQ is negative for the day, the NASDAQ may have a negative pull on the DOW and hinder its ability to continue trending.

You want to watch to see if the markets are splitting any of the following levels:

  1. Yesterday’s Close.
  2. 50 MA
  3. Central Pivot

“Splitting” any of these 3 levels, means that one of the four markets is above and another is below.

For example, if the S&P is above its close from yesterday, but the NASDAQ is below its close from yesterday, then the overall market condition would be considered “bifurcated.”

Another example: If the DOW is above its Central Pivot, but the S&P is below its Central Pivot, then the overall market condition is considered “bifurcated.”

Although one market will always be stronger than another market, the strongest trending days usually occur when all 4 of these markets are clearly bullish or bearish. When the markets all move together, they move more freely and tend to follow-through more … sometimes trending in one direction for the entire day.

I like to have a quote screen with the following markets at the top:

  • S&P
  • Russell
  • DOW
  • NASDAQ
  • NDX
  • ES
  • ER2 (or AB)
  • YM
  • NQ

On the quote screen I include a column for “Net Change” from yesterday’s close. This allows me to see in an instant if the markets are aligned with yesterday’s close.

  • If they’re all red, then they’re all below yesterday’s close.
  • If they’re all green, then they’re all above yesterday’s close.
  • If some are red and some are green, then the markets are bifurcated.

In the quote window below, all the markets are aligned to the downside, with all of them below their respective “yesterday’s lows” for both Cash and Futures.

THE SPECIAL OFFER

As a Special Bonus for those who read this article, you’re entitled to get one of my Mini-Courses for free. It’s entitled:

“Make Money by Breaking Every Trading Rule You Ever Learned”

… and you can get it free by clicking the button below.

ABOUT THE AUTHOR

Author: Dr. Barry Burns
Company: Top Dog Trading
Website: TopDogTrading.com
Services Offered: Trading Education, Free Videos, Books
Markets Covered: Stocks, Options, Futures

Barry Burns is the founder and CEO of TopDogTrading.com. He is the author of Trend Trading For Dummies.He is also a regular presenter and contributor for several exchanges, including the CME Group and Eurex, as well as the author of Top Dog Trading 5 Energy Methodology Plug-in for MetaStock.​

Chapter
04

HOW TO LEVERAGE VOLATILITY IN TODAY'S MARKETS

By Steven Primo, ProTraderStrategies.com

What if I told you that all that was needed to increase your trading consistency during volatile markets was to simply change the settings of a very common indicator? And what if I said you could begin applying this method as early as today? Join Steven Primo, 42-year trading veteran and former Stock Exchange Specialist as he presents "Leveraging Volatility - Best Best Strategy For Today's Markets."

This is Steven's premier continuation strategy that can be applied to any market and time frame. In this presentation Steven will not only reveal the entry rules to this method but also show you recent examples of this strategy in action. Whether you are a skilled investor or new to trading, you can't afford to miss this educational presentation.

THE MOVIE: HOW TO LEVERAGE VOLATILITY IN TODAY'S MARKETS


THE SPECIAL OFFER

Get a 30-Day Trial of My PTS Primo Charts Program for just $7!

What you will get:

- A full, 30-day trial of my program for just $7

- You will get the trading strategy discussed in this video (Trading Strategy 3a)

- "STEPS" 1 & 2 Entry Techniques for fine-tuning your entries into trades

- Strategy Signal Scanner - Know which markets are triggered, according to the strategy

- Enhanced "BUY/SELL" line, which signals when markets are trending up or down

- Over 90 Technical Indicators

- Free Bloomberg TV for fundamental analysis

- Personalized Tech support for your individual needs

ABOUT THE AUTHOR

Author: Steven Primo, Founder
Company: Pro Trader Strategies, Specialist Trading
Websites: ProTraderStrategies.comSpecialistTrading.com
Services Offered: Trading Courses, Trade Signals, Member’s Section, Videos
Markets Covered: Stocks, Emini Trading, Forex, Day Trading, Swing Trading

Scores of students, from beginner to advanced levels, have gone on to become successful traders after being introduced to Steven’s proprietary methods of trading.

Chapter
05

The Uptrend in Equity Markets Has Ended. Economic Growth Has Not

By David Aferiat, Trade-Ideas.com

Navigating a Complex Market

Information asymmetry remains at the heart of successful alpha strategies in equity markets. Some people have the information they need for better decisions, other people miss the opportunity entirely.

Sophisticated innovations in Artificial Intelligence level the playing field for wealth and fund managers in an environment where global banks and colossal funds have historically leveraged capital and PhDs to gain an advantage. Opportunities now exist to make smaller players the beneficiaries of such capability. 

With AI, massive structured and unstructured data sets in US equities are analyzed daily across infinite scenarios involving tens of millions of simulated trades.  From there wealth managers are in a better position to use resulting analysis to decide on strategy, reduce risk, and capture alpha outcomes. Consequently, as you ask better questions about what’s working in the markets, you get better answers.

Yet, understanding overall trends in the market and crafting a coherent investment response remains essential.

Where the Market is Headed as of August 2019

Currently, analysts are focused on earning prospects which appear favorable. Stock prices, however, do not look favorable as we roll into the back half of 2019.  The power of the default up trending market is over.  American stock market indices produced a double top and recently broke their 200 day moving averages.  60% of the stocks in the NASDAQ composite are in downtrends.  A narrow group of stocks made new highs when the indexes hit their highs.  History shows that stocks peak 12 – 18 months before earnings peak when a major top occurs. 

Source: MarketWatch Dr. Jean-Paul Rodrigue, Hofstra University

There has been a pop and drop market environment for some time now, demonstrating a need for better tools.

What Tact Should We Take?

One example provides a hint on how to prepare for what may come: Bridgewater Associates, LLC. The asset allocator managed the top performing hedge fund in 2018. 

Guess what?  This manager is much more sophisticated than one would consider an asset allocator to be. Artificial Intelligence (AI) is a core contributor to Bridgewater’s success.

Risk management is a necessary part of money management, but a bull market hides a great many sins. Advisors without a clear plan for risk control will not be successful in the years ahead. When the stock market has risen consistently it is difficult for a money manager to differentiate the firm’s track record from other large diversified portfolios and indexes. Thus the constant pressure to reduce fees.

In a declining market a manager with excellent risk management techniques and a focused portfolio stands out. The reverse of this is that a manager without risk management in place may expect a great deal of litigation costs in the years ahead as well as an intense migration of funds out of the firm.

Bottom line: Managers must plan out market correction scenarios across multiple timeframes and identify the means in which they will determine when decisions, that will define their 1-year, 3-year, and 5-year performances, must be made. Machine learning AI making sense of the market movements will prove to be a key differentiator in who survives and who does not.

THE SPECIAL OFFER

Check out the new Trade Ideas eBook "Active Investing For The Passive Trader", written by our very own Sean McLaughlin & Michael Nauss.

ABOUT THE AUTHOR

Author: David Aferiat
Company: Trade-Ideas
Website: www.Trade-Ideas.com
Services Offered: Market Navigation Tools and Indicators, Trading Alerts, Trading Education, Educational Videos
Markets Covered: Stocks

David Aferiat brings more than 15 years of experience in trading, consulting, software, utilities, capital markets, and consumer product industries. Working with senior officers and key decision makers in the boardroom, finance, HR, marketing and trading functions, he has advised both public and privately held companies with revenues ranging from $20 million to $14 billion.

WAIT! The Gains of FOREX Trades without Trading Forex?

Yep, finally, the code has been cracked.

The world's best currency expert has teamed up with a legendary stock and options trader to grab the massive gains of the Forex market without the risks or special account needed to trade FX...

You have to see this.

Watch the Presentation Here

Chapter
06

Trading the $VIX Futures Term Structure

By Lawrence G. McMillan, McMillanAsset.com

The CBOE introduced the Volatility Index ($VIX) in 1993. The calculation of $VIX has changed a couple of times over the years, and due to the complexity of those calculations, $VIX itself cannot be traded.  However, in 2004, $VIX futures were listed, and in 2006, $VIX options were listed.  $VIX futures are the underlying instrument for all of the Volatility ETN’s and ETF’s that exist today (VXX, for example).

There is a lot of information in the $VIX futures – primarily in their relationship to $VIX (discounts or premiums) and in their relationship to each other (the term structure).   We use those two things to determine the “construct” of volatility derivatives – a stock market indicator that we track in our general Market Commentary in our newsletters.  But in this article, we’re not concerned with stock market predicting as much as we are in trading the market.

What is The Term Structure and Why Does It Slope?

The term structure of the $VIX futures refers to the price relationship that the futures have with one another.  For example, an upward-sloping term structure generally occurs during a bullish stock market.  The nearest-term futures would be the lowest-priced, then the second month futures would be slightly higher-priced, and the third month higher than both, etc. 

The reason that the term structure slopes upward in bullish times has nothing to do with the futures market attempting to predict implied volatility.  In fact, it’s just the opposite: due to the vagaries of attempting to predict where long-term volatility is going to be, market makers will price longest-term $VIX futures somewhere near the average of long-term volatility.  But in a bullish market, volatility is low, so the near-term futures will be trading with a volatility that is below average.

Consider an option buyer who approaches a market maker and asks, “At what implied volatility would you sell me a 3-year option?”  Since the market maker has no idea where volatility will be in three years, he will price it an average long-term volatility – say 25% in this case. Then the option buyer says, “At what implied volatility would you sell me a 1-week option?” Supposing that the stock market is bullish, and near-term implied volatility ($VIX) is 13, the market maker will price the near-term option with a 13 volatility. These two implied volatility points are shown in Figure 1. Futures at those time frames would reflect the same volatilities.

By inference, points in between would line up accordingly.  Two-year options are still very difficult to price, but in a bull market they might trade with a slightly lower implied volatility than the 3-year option.  Similarly, a 1-month option is going to be somewhere near the current level of $VIX, but because there is less certainty about where $VIX is going to be in a month as compared to where it’s going to be in a week, the 1-month option will price with a slightly higher volatility than the 1-week option would.  The result is that various implied volatilities of different lengths will fall along the curve, as shown in Figure 2.  Hence, in a bull market, the term structure slopes upward like this.

Conversely, in a bearish stock market environment, $VIX is elevated and near-term options trade with a higher-than-usual implied volatility.  Long-term options are still as difficult to price as ever, so a 3-year option in a bearish environment is still going to price with an implied volatility reflecting the average volatility.  But the near-term option will have a much higher implied.  Hence the term structure slopes downward in a bear market (Figure 3).

So, putting this information together, we can see that the term structure of the $VIX futures will transition from upward-sloping to downward-sloping when stocks fall after a period of rising stock market prices.  Conversely, after a bearish period in the stock market, the term structure will transition from a downward-sloping one to an upward sloping one.  These concepts are shown in Figure 4.

Trading the Term Structure 

We can take advantage of these facts in order to trade the stock market itself, although we would be using $VIX futures to do this, rather than “normal” stock market instruments such as SPY, SPY options, $SPX options, or e-mini S&P futures and options.

I do not mean that we would be trading $VIX futures outright.  That is, if we were bullish on the stock market, it might be profitable to short $VIX futures.  Conversely, if we’re bearish on stocks, if might be profitable to buy $VIX futures.  That is not what I’m referring to here, though.

What I mean is that we will trade the $VIX term structure in order to capitalize on bullish or bearish stock market opinions.  Why would we do this?  For leverage.  According to the CBOE Futures Exchange (CFE) – which is where $VIX futures trade – margin requirements, there is a reduced margin requirement if one has a spread (long one contract, short another contract) in the first three months of the $VIX futures.  So that would be a spread between the first two months, or a spread between months one and three.  In the early days of $VIX futures trading, the margin for this spread was a mere $50!  Then, after the CFE realized this was way too speculative, the margin requirement was raised a few times to a still-very-lenient $625.  Over the years, the margin has been raised further, to be more in line with the risk/reward characteristics of the spread, and it currently stands at $3,311.  You can always quickly check the various $VIX margin requirements by going to the CFE web site, at the following URL:  http://cfe.cboe.com/margins/cfe-margins.

In contrast, the margin for trading the front-month $VIX futures contract as an outright long or short is currently $8,800.  So you can see that trading the term structure requires less margin than trading the $VIX futures outright.  At today’s level, the difference is probably right in line with the risk-reward, but in the early days, spread margins of $50, $100, $500, or $625 (which is where they were at one time or another) for the $VIX spread were overly low.

Example of A Bullish Trade

So, let’s see how this would work in practice.  In this example, suppose the stock market has been declining rather sharply, and you get buy signals from your indicators.  You could trade them in the traditional manner, using SPY options, for example.  But you may also want to consider trading the term structure. 

Since our assumption is that the stock market has been falling, let’s assume $VIX has risen and is trading at 26.  The following prices exist:

                                $VIX: 26.00

                                $VIX August futures: 24.35

                                $VIX September futures: 22.80

                                $SPX: 2750

The futures are trading at a discount to $VIX and the term structure (at least for the first two months) is sloping downwards.  These are typical characteristics of $VIX futures during a bearish trend in the stock market.

If we are getting buy signals on the stock market (perhaps from put-call ratios, breadth oscillators, or any other trusted indicators), we would expect the term structure to begin to flatten and perhaps even reverse to the point where the term structure would slope upwards.  The way to take advantage of this projection is as follows:

                Bullish (stock market) trade: Sell the front month $VIX futures

                 And Buy the second month $VIX futures


In this example, then, we’d Sell August futures @ 24.35 and Buy September futures at 22.80.

We have entered this spread at a price of 1.55 (August over September).   Futures spread markets aren’t quoted as “credits” or “debits” as option trades are; rather, one specifies the price and which side is at the premium.

$VIX futures terms state that a one-point move is worth $1,000.  So, if the spread were to flatten out in a rallying stock market, and the two futures traded at the same price, one would make 1.55 points, or $1,550 at $1,000 per point.

In fact, suppose that a strong stock rally takes place, and a week later these prices exist:

                                $VIX: 19.00

                                $VIX August futures: 19.70

                                $VIX September futures: 19.90

                                $SPX: 2850

In other words, the stock market has rallied ($SPX is up 100 points), $VIX has fallen, and the term structure has a very small upward slope.  Here is the P&L on our trade:

                Position                                                                Current Price                      Current Profit/Loss

                Sold 1 Aug $VIX future @ 24.35                              19.70                            +4.65 points (+$4,650)

                Bot 1 Sept $VIX future @ 22.80                               19.90                           –2.90 points (–$2,900)

                Total: +1.75 points (+$1,750)

So the spread has made $1,750 on a margin requirement of $3,311 – a very strong return, reflecting the leverage that exists in this trade, even using today’s “inflated” spread margin requirements.

At this point, one might still have buy signals in place and could continue to hold the $VIX futures spread, or could take profits.  One would normally act in line with his indicators.  Any further rally in the stock market should cause the spread to continue to move in our favor – up to a point.  The term structure won’t get ridiculously steep, but if $SPX were to rally strongly for another week, the spread might widen out to 1.00 or so, increasing our profits.  After that, it probably can’t widen much more.

So, this type of approach has a limited profit (and limited loss), although if the stock market suddenly crashed, the spread could move very steeply against us.  For example, in the financial crisis of October 2008, the front month $VIX futures traded 18 points above the second month.  That would be a loss of over $16,000 in this spread!  Hence, despite the fact that the two futures will eventually come back into line when the market stabilizes, that does one no good if he were to be stopped out via a margin call while the spread was in place.  That’s why it’s important to use trusted indicators that have stops, when using this highly leveraged approach to trading buy and sell signals from your indicators.

To trade bearish stock market sell signals, one would buy the front-month $VIX futures and sell the second month.  Then he would want the term structure to invert (slope downwards).

Other Uses of Trading The Term Structure    

One can trade the $VIX term structure for other purposes – it doesn’t have to only be a speculative position on the stock market.  For example, with the bearish version, one might trade it as a hedge against a stock portfolio.  I wouldn’t routinely use it – that is, I wouldn’t just have the bearish position in place at all times as a hedge against a long stock portfolio, because most of that time that would just be wasting money.  But when sell signals arise, then you could put it on as partial protection for your stocks.

The nice thing about the $VIX term structure futures spread is that there is no time value premium being spent for the spread itself, as compared to other forms of hedging/protection: put purchases in $SPX or SPY, or call purchases in $VIX.  Of course, put and call purchases have limited risk, and the term structure spread does not have defined risk, but at least if you’re losing money in the hedge, you should be making money with your stock portfolio.

This approach can even be used to hedge any portfolio of options with downside stock market risk.  For example, this might be a portfolio of naked puts or put credit spreads.  This is the approach that we use to hedge our risk – when it is called for – in the Volatility Capture CTA strategy for our managed accounts.  In the Volatility Capture CTA strategy, we solely use futures products – no $VIX calls, for example – so the approach of using the $VIX futures calendar spread is one that fits will within the parameters of this strategy.

So the next time you have speculative signals on the stock market consider using this highly leveraged approach to trade “the market.”  Furthermore, if your signals are sell signals – and you want to speculate bearishly, or maybe you just want to hedge your stock portfolio – you can also consider trading the term structure.

THE SPECIAL OFFER

Get a free 30-day trial to my flagship advisory service, The Option Strategist Newsletter.

Scroll to the bottom, click the “ADD TO CART” button ($28.75) and enter the Coupon Code TPFREE at checkout. No credit card is required. Subscription will not automatically renew upon completion.

ABOUT THE AUTHOR

Author: Lawrence McMillan, Founder
Company: McMillan Asset Management
Website: McMillanAsset.com
Services Offered: Trading Education, Account Management Services
Markets Covered: Stocks, Options

Lawrence is well-known as the author of “Options As a Strategic Investment”, the best-selling work on stock and index options strategies. The book – initially published in 1980 – is currently in its fifth edition and is a staple on the desks of many professional option traders.

Chapter
07

My Best Strategy – Use the Average True Range

By Scott Barkley, ProActTraders.com

If you are going to leverage volatility in the market, why not use the tool that was designed to do just that. That tool is Wilders Average True Range (ATR) tool. While  it works in all markets: stocks commodities etc., it is especially accurate in the Forex market. If you know the ATR for the day you know where the Big Boys (BANKERS) are trying to take the currency TODAY. This gives you a statistically valid target that the tool proves day in and day out that the market makers are trying to do. 

What would happen to your trading if you opened up your charts and in a few seconds you could pinpoint where the currency pair is trying to go today?  What would happen if you saw that you were to close to doing the ATR today and so you passed on a trade EVEN THOUGH YOU KNEW WHERE IT WAS TRYING TO GO but you passed because there was not enough ATR for the currency to give you a low risk high reward trade? What would happen if you knew the target to day and just got a pullback offering another opportunity to add a position to the target. What would that do to your trading accuracy and also increased pip capture?

In this video, we’ll show you what the ATR can do for you, how to use it and most importantly how to profit from its amazing accuracy. It is a short video – only 16 minutes long but it is packed with real meat and no fluff. So take 20 minutes out of your day and see if this video can revolutionize your trading in the Forex (or any other sector as well).

THE MOVIE: MY BEST STRATEGY - USING THE AVERAGE TRUE RANGE

THE SPECIAL OFFER

We teach Target Trading in the Wide-Open Spaces every day in our live room in both the London and the New York sessions.  If you come and sit in one of our rooms, you will see traders just like you make hundreds of pips.  You can sit in the room for 7-days and just watch if you like.  You can also get a 10-day trial of our amazing charting software that is designed to help a trader find the WOS and the momentum in the market.

Both of those are FREE! 

ABOUT THE AUTHOR

Author: Scott Barkley, Co-founder
Company: ProAct Traders
Website: ProActTraders.com
Services Offered: Trading Education, Software, Trading Room
Markets Covered: Forex

Scott Barkley is a co-founder of ProAct Traders and is an award-winning Forex Trainer who has mentored students all over the world since 2004.  ​

Chapter
08

Price Action Strategies

By Vince Vora, TradingWins.com

It's always amazing to learn about the habits of successful traders. From the thousands of traders that I've coached over the years, some of these common habits are risk-avoidance, sound money management and the ability to keep emotions in check. But more importantly than having these habits is having the discipline to apply them consistently.

I've found that there are many traders who would be considered mediocre for their stock picking skills but have been highly successful because they consistently apply good trade management principles. Conversely, the market is littered with traders who were very good at picking stocks but were not good at consistently applying good trade management skills.

The video here will show you how I use Price Action in my daily trading and, more importantly, why consistency is a key factor in trading success.

THE MOVIE: PRICE ACTION STRATEGIES

THE SPECIAL OFFER

Get the Magic of Price Action – Pro Training

Learn the full strategy from entry to exit, and is specifically designed for trading stocks, options, futures, and forex in today's volatile markets.

ABOUT THE AUTHOR

Author: Vince Vora, Senior Trader
Company: Trading Wins
Website: TradingWins.com
Services Offered: Trade Alerts, Daily Market Commentary, Nightly Videos
Markets Covered: Stocks, options, Forex, Futures

Over the last three decades, Vince has been trading and refining his trading systems that are based on technical analysis and price action. Over the last few years, his focus has been on teaching people how to become better traders.

Chapter
09

A Strategy for Consistent Profits

By Doug Campbell, RightWayOptions.com

I remember the frustration I felt as a new trader searching for knowledge and finding incomplete or flat out contradictory information. So I scrapped everything I had written and started over. I decided to write this article detailing just one trading strategy that works extremely well no matter the size of your account. It’s effective for both full and part-time traders and, the best thing is, it’s simple.

I said simple, not easy. The strategy I will lay out for you in the following pages requires discipline, focus, and that four letter word, WORK. There is no easy button when comes to trading. The truth is most trading strategies can be profitable if you master the biggest danger to your trading. That danger is YOU! That’s right, master yourself and most any trading strategy can be profitable.

Is there the possibility of losses? Yes!  In fact, if you trade actively, losses will happen on a regular basis. However, if you follow the steps, I’m confident you will see improvement in your trading results. Winners will far outpace your losses, and your confidence will grow right along with your account. 

 I have traded full-time for more than 12 years and use this strategy every day. If you're willing to change and have the discipline to follow a simple set of rules, I believe it will produce consistent profits for you as well.  So let’s get started!

Embrace Change

As a trading coach, I have had the pleasure of working with traders from all over the world. I can tell you that a key element of success is the willingness to change. Without question, all traders have the desire to make money but it is a rare few that have a willingness to embrace change. I understand that change can be uncomfortable and it usually means a lot more effort is required.

Are you really happy with the direction of your trading? If you’re reading this, my guess is the answer to that question is No. In fact, haven't you sufficiently proved to yourself what’s not working? If you keep doing what you’re doing, should you expect your results to miraculously improve? Not likely!

It’s time to question and evaluate everything. I’m going to introduce several ideas that you may want to dismiss out of hand as being too simple to actually work. When that thought comes to mind, I want you to re-ask the question: Are you happy with the direction of your trading? 

Plan your trade and trade your plan.

When I began trading 27 years ago, I started with a very small account. If fact it was almost microscopic! I had read several books and taken several classes that started by telling me the importance of having a trading plan. Of course, I ignored that because how could that apply to me and my small trading account?   Surely that only applied to those with more substantial accounts. Wrong!

Having a well thought out trading plan is essential for all trading accounts no matter the size. There is no shallow end or kiddy pool available in the market. If you are in the market, you are directly competing with the best and brightest. They have a plan and trust me they will not apologize or even think twice about taking your money.

Traders without a plan are subject to poor emotional decision making in the heat of the moment. Trading is a business and must be treated as such. Those with small trading accounts have very little room for error. If your plan is just to wing it, then prepare to be quickly parted from your money. I know that may sound harsh, but it is the truth. If you fail to plan, then plan to fail as a profitable trader.

Embrace Simple Charts

Price is king! New and struggling traders often make the mistake of overcrowding charts with indicators. They spend days, months and even years searching for the perfect combination of indicators that will provide consistent profits. Let me save you some time. It doesn't exist.

Many traders fall into the trap of believing that indicators give you the power to predict future price action. While indicators can provide useful clues, it’s wrong to think they have the power to predict all the possible outcomes. The market is full of fools attempting to predict future price action. Sure they can be right from time to time but even a broken watch tells the correct time twice a day.

I have built an entire trading career around following price action rather than trying to predict. I make trades come to me rather than me chasing after them. As a result, you will never see my talking head on CNBC but I will console myself by taking consistent profits to the bank.

Build a Qualified Watchlist

Making trades come you, requires building a watchlist of stocks that qualify. Working from a watchlist prevents chasing trades and allows the trader time to prepare. Another problem I often run into is traders chasing after the flavor of the day stock that is popping higher. When a stock is popping, traders will rush in, not considering the risk first, and immediately put themselves in a higher risk trade that may not be suitable. On the other hand, many traders will see the move and decide they have already missed it and stop watching the chart altogether. Both of these potential issues are easily fixed when working from a qualified list.

Building a qualified watchlist is much easier than you may think. First, we only want to look at stocks that  fit with our account size. As an example let’s say you have a $20,000.00 trading account. Higher priced stocks would require too much of your account in a single trade. On the other hand, you may have rules to avoid very low-cost stocks or biotech companies due to their high volatility. To be efficient, screen out all stocks that don’t qualify.

Also we want to screen out all the stocks that don’t meet your volume requirements. Lastly, we only want to focus on stocks that are currently trending with the direction of the overall market. I do this using a 34EMA (exponential moving average) that has been trending at least 20 days.

From this simple screen, I build my watchlist and begin preparing for the next entry.

Preparing for the Trade

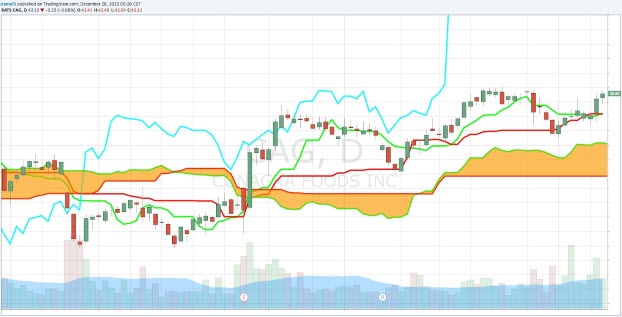
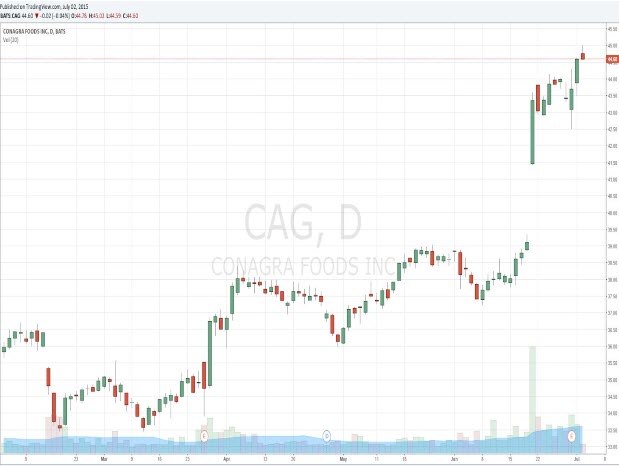
Now that we have a good list of trending stocks we have to begin preparing for the next entry. I do that by marking up the chart with support, resistance, and trendlines. I recommend using a chart cleared of all indicators and a white background with black and white candles. The human eye is much more receptive to black and white images. Seriously, if you look it up, you will find this to be true. Remember that question: Are you happy with the direction of your trading?

I call it a naked chart and you may be surprised that 99% of my trades are found using this simple chart without a single indicator.

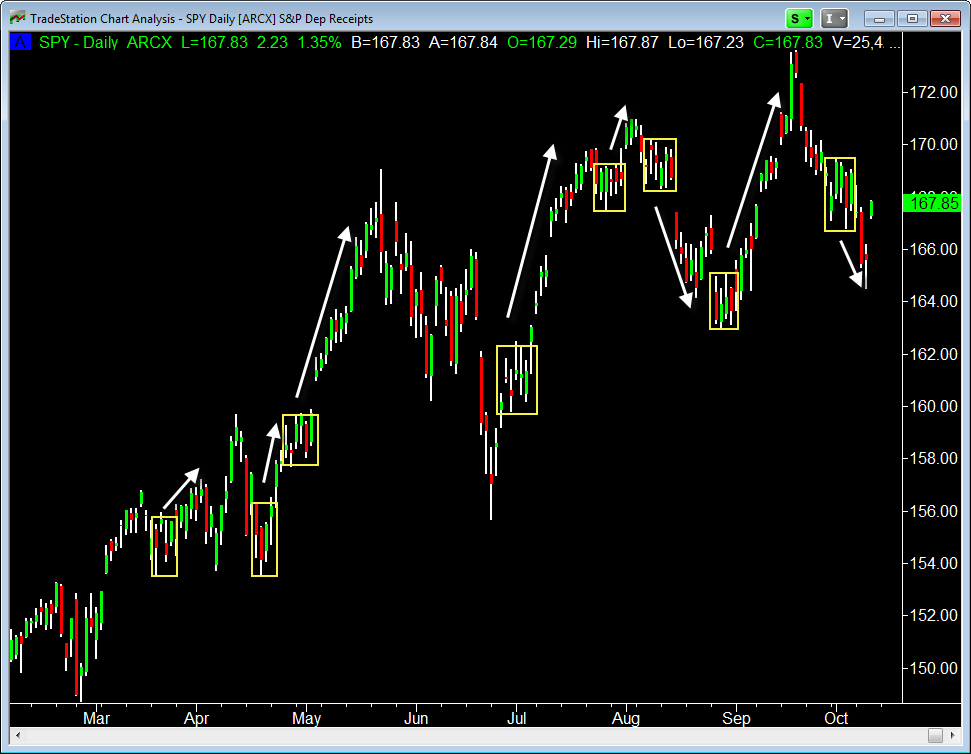
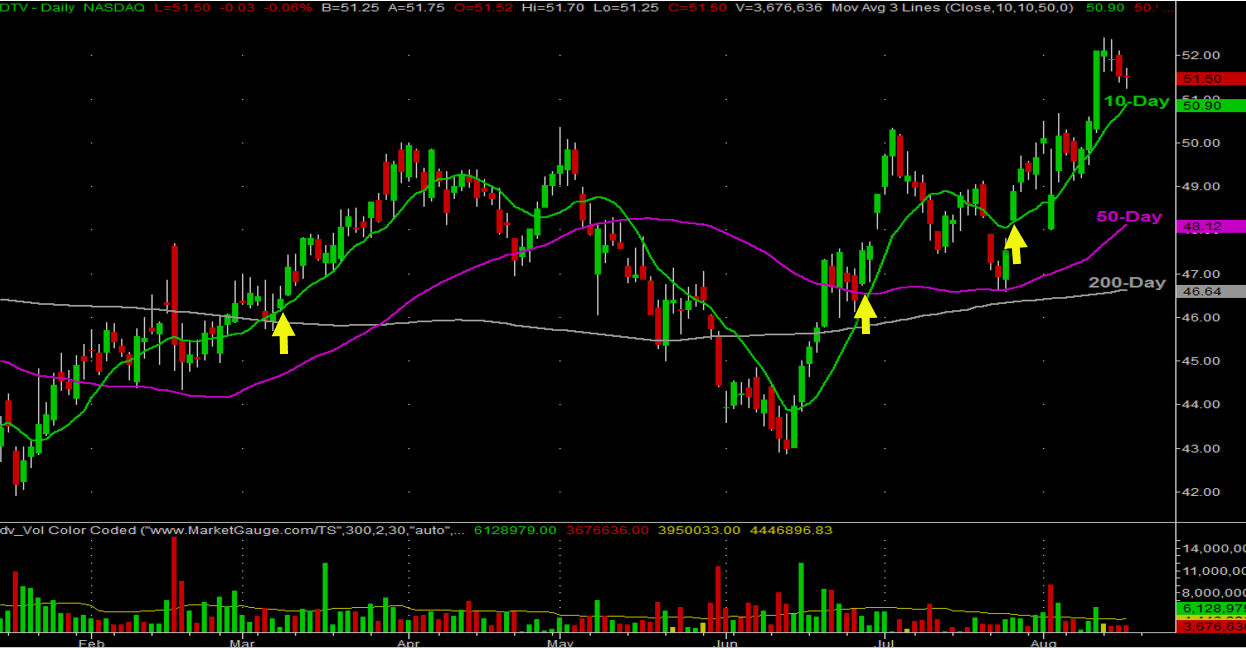
As you can see in the chart above, potential entries are easily identified.  Because we are waiting for the trades to come to us, they can be planned for without rushing.  The potential entries marked on the chart are near price support levels allowing for tight stop-loss orders and low-risk trades.

One Indicator for Easy Entries

Could it be any easier? Yes, by adding just one indicator called Volatility Stop Indicator on my TC2000 Platform. It is an Average True Range indicator with these settings. True Range Period = 10, True Range Multiplier = 1.50. At the end of this book, I will provide links to setting up the indicator in TC2000 as well as on thinkorswim charts. Please feel free to reverse engineer it for any charting platform you use.

First, please understand there is nothing magic about this indicator. Price is still, and will always be, a top priority. I am an unapologetically conservative trader. I am also very selective about the charts and the trades that I take. In my opinion, Quality is far more important than Quantity especially if you want to improve your win/loss ratio and consistently profit.

The chart above is the same chart of Weight Watchers with the Volatility Stop Indicator turned on. The Red dots indicate price resistance and the Green dots mark price support. I recommend placing stop-loss orders just above the Red dots for a short trade and just below the Green dots for a long position. Notice the potential entries marked with the red circles are very close to where stop orders are located. This placement creates low-risk entries!

Simply follow when you see buyers reacting to price support. That means wait for the buy signal. No predicting, no guessing required! Once in the trade, manage the position by adjusting the stop at the end of the period you are trading (end of the day in this example).

Please note if you miss an entry, there is no need to chase it. As long as the stock remains in the trend, all you have to do is wait and prepare for the next low risk entry. Remember, we are looking for Quality over Quantity and don’t waste time with a stock that does not prove it’s worthy of  your money.

You can now be in control, making the trades come to you! Follow the rules and this strategy is pretty hard to mess up.

Longer Term Traders

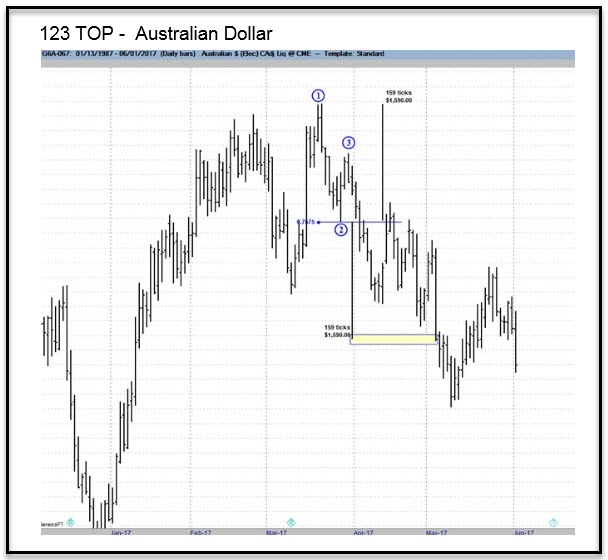
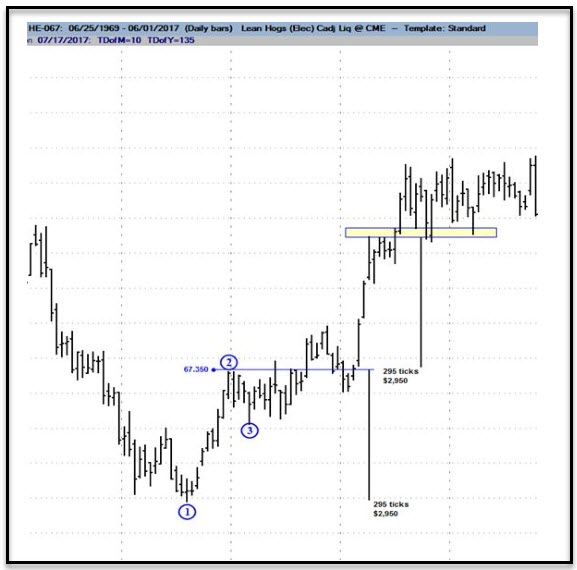
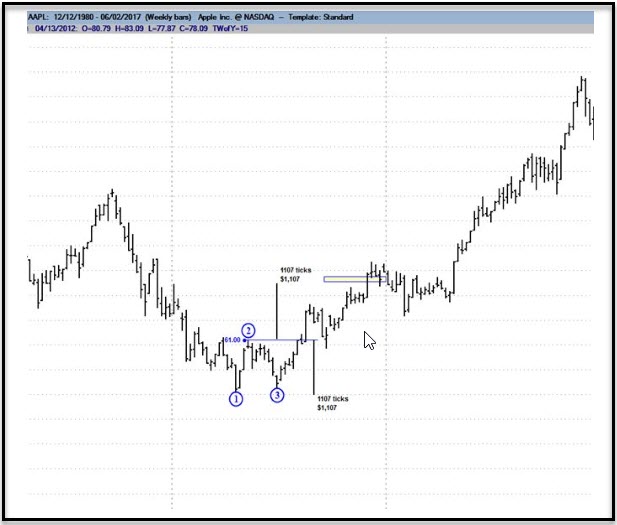
If you like longer term trades, take a look at the weekly chart below.  Again, easy to spot low-risk entries that can be held confidently for months.  Just follow the price up as long as the trend continues.

Day Traders

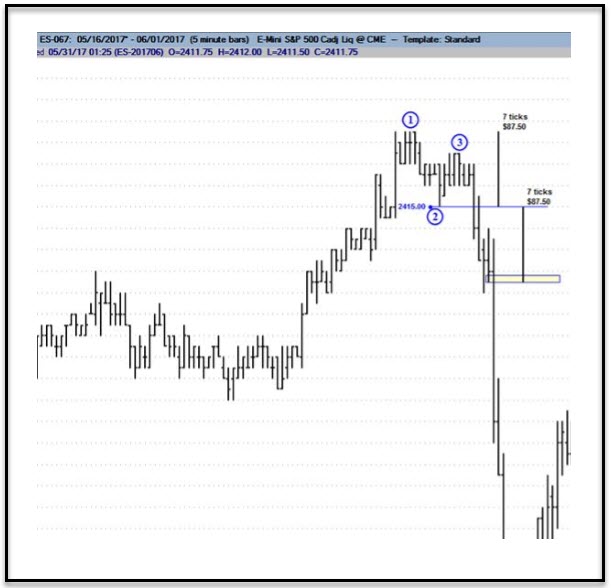
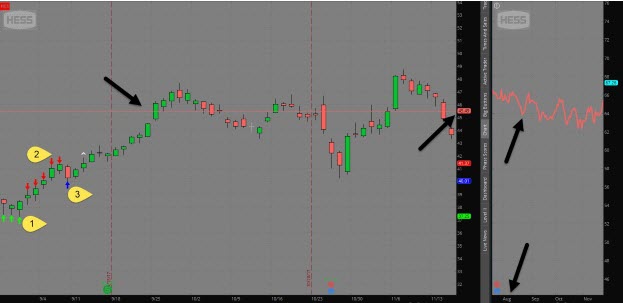
Yes, it works just as well for those of you that prefer intraday trading.  The 5-minute chart below is trending up, so all you have to do is wait for a low-risk entry and manage the trade by moving the stop at the end of each period.

Following Price Action


A question that I am commonly asked is, “What’s the buy signal”? What they are really saying is, “Just tell me what candle to buy.” I’m sorry to burst your bubble, but its never that easy. Put ten traders in a room with a  chart to pick out buy signals, and you're likely to get ten different answers. What YOU see in the chart is the only opinion that should matter because that will be the basis of your trade plan.

Plan Your trade and then stick to Your plan!

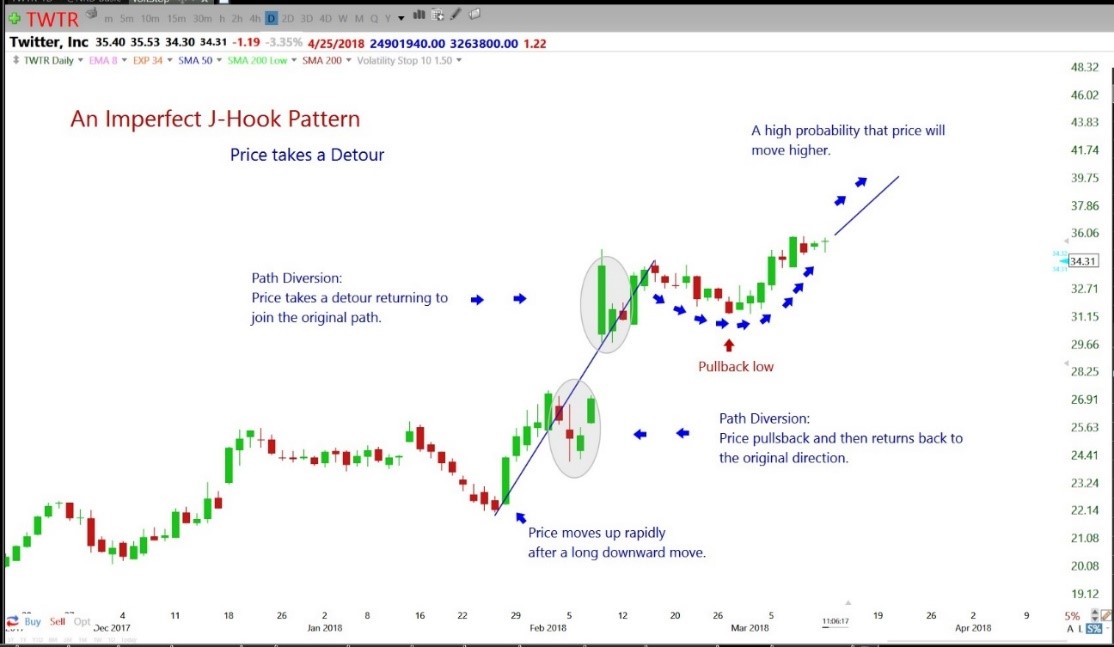
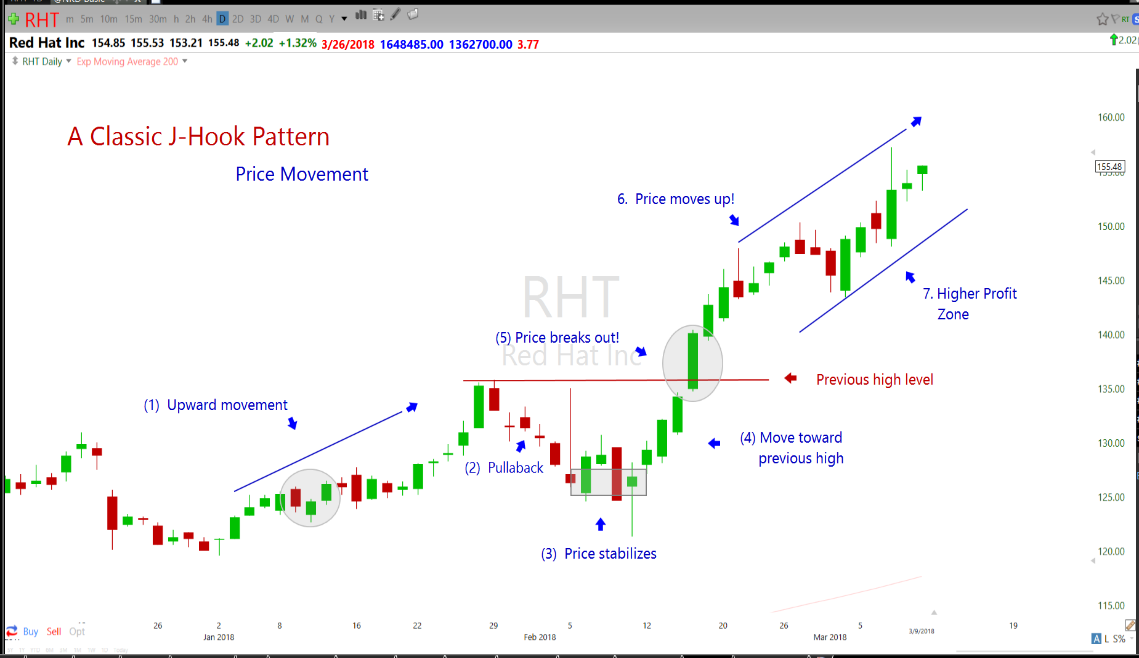
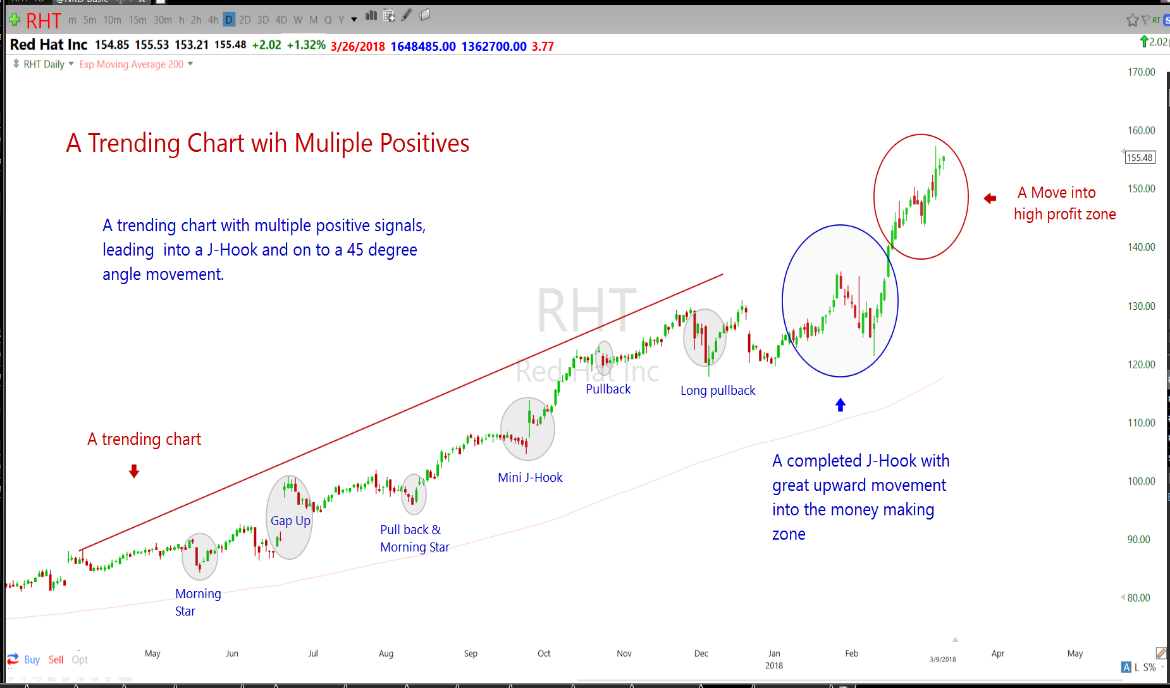
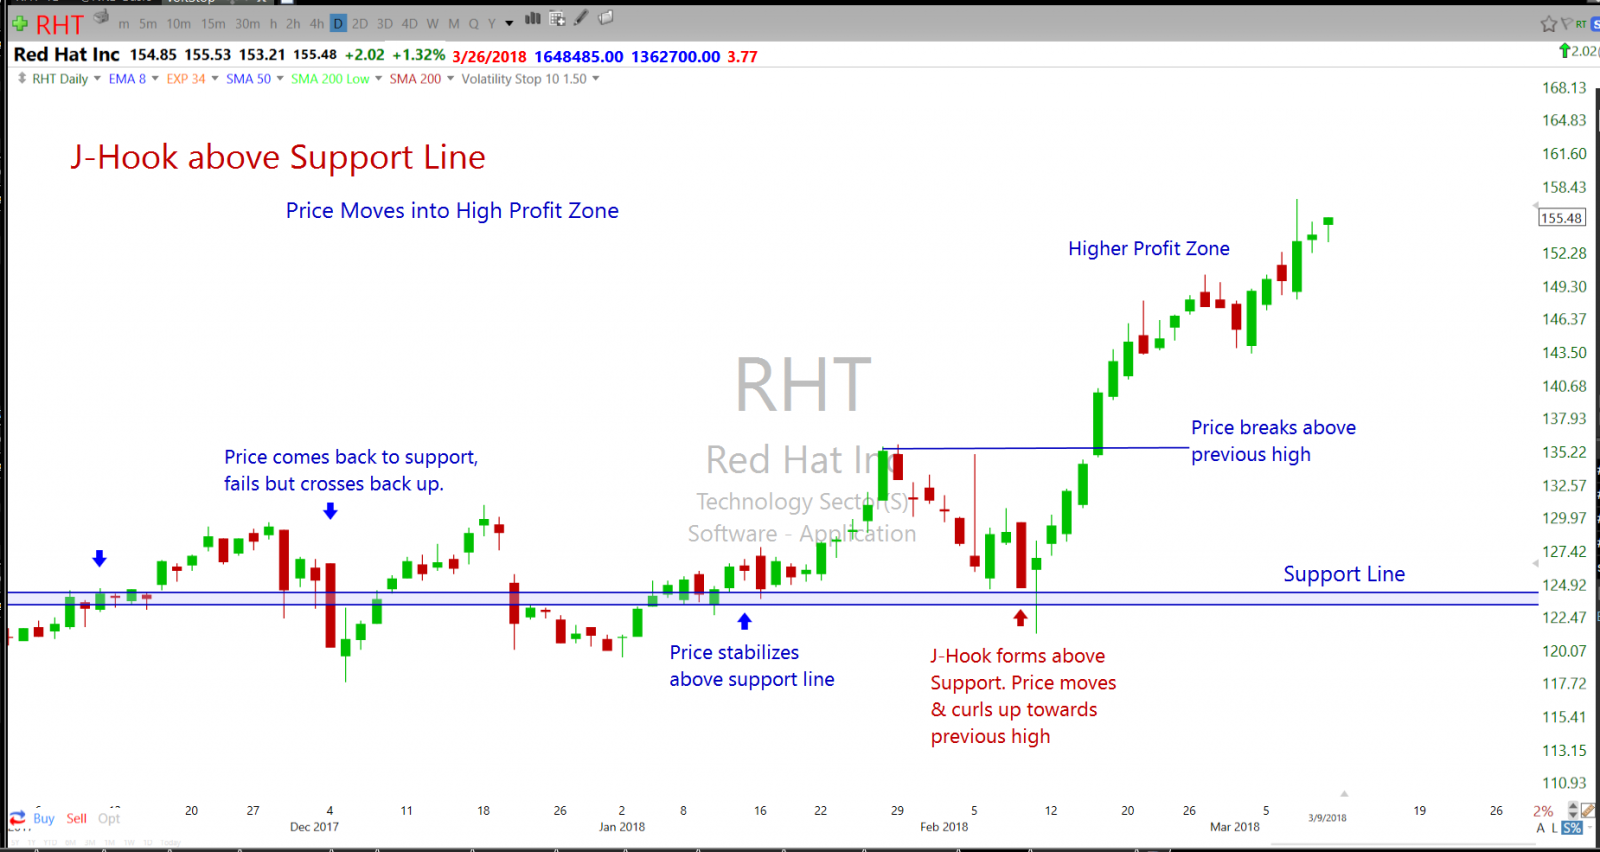
As for me, I am looking for evidence of buyers reacting to price supports or trends. The signal might form a bullish engulfing, morning star or hammer candlestick pattern. Most important to me is where the signals are placed in the overall price pattern of the chart. 

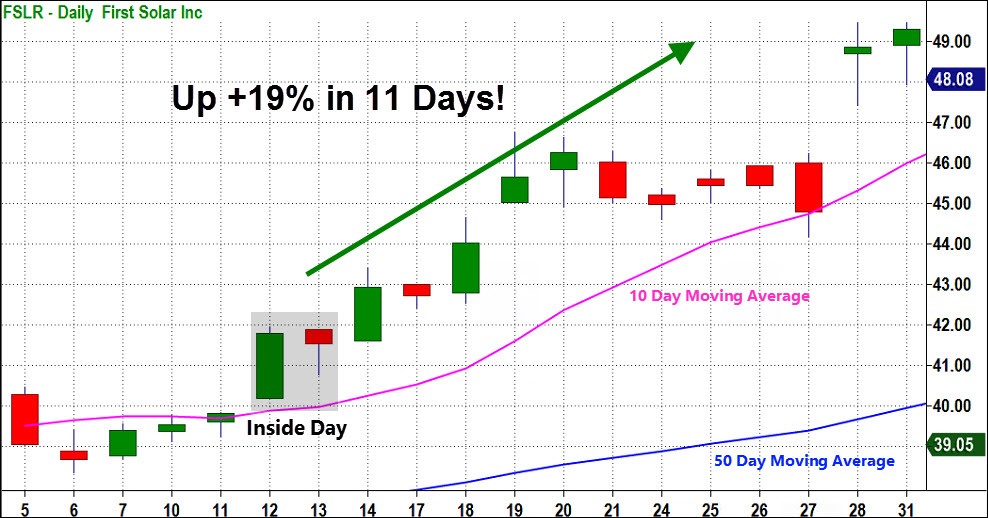
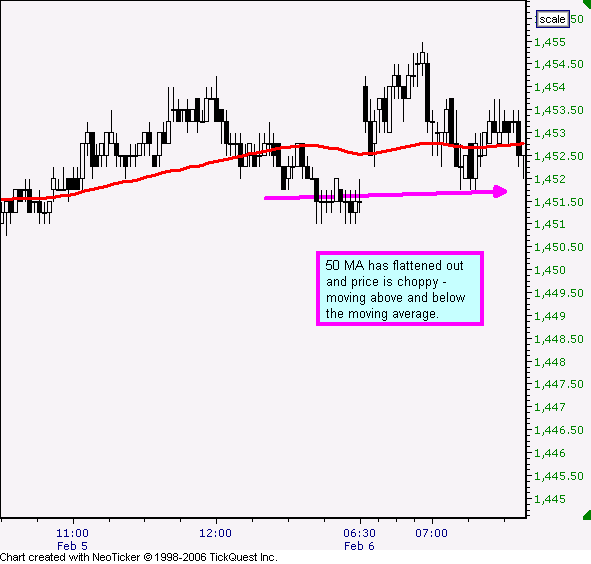
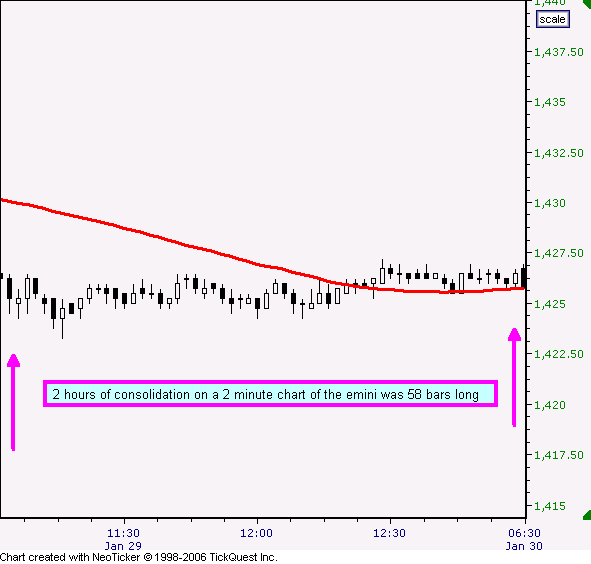
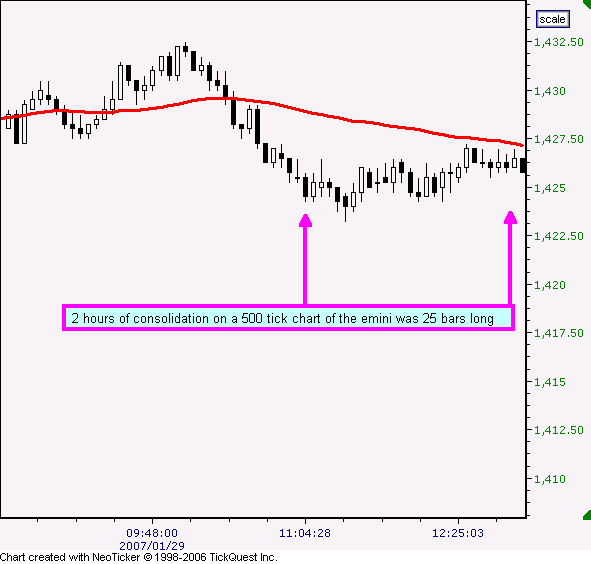
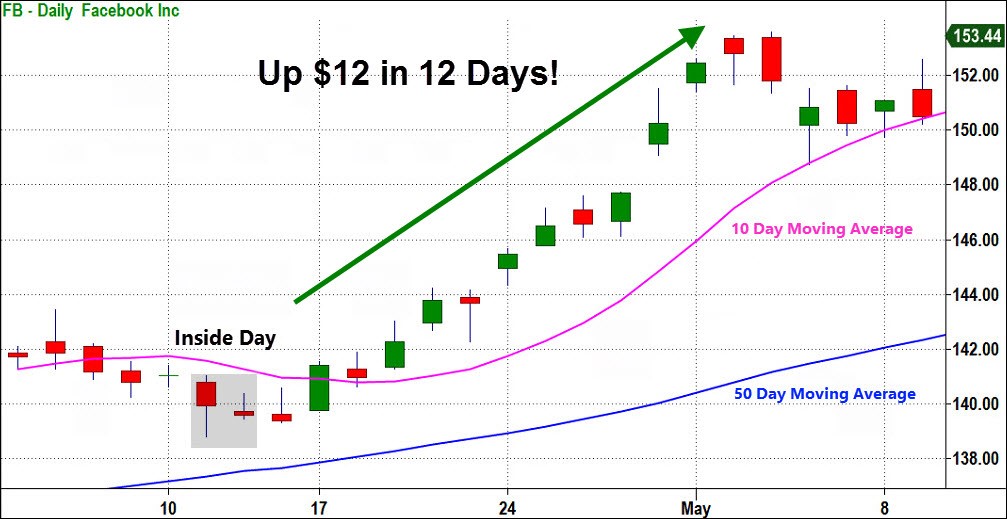
A pattern that I often trade with great success is what I call a Pop-Out-Of-The Box. It is a tight consolidation within a trend. See the chart below. If you are interested in learning more about the Pop-Out-Of-The-Pattern, I have a full workshop diving into the details of the pattern. Check it out on our website. 
Pop-Out-Of-The-Box Pattern Information

Lessons Learned

Not only do we want to choose entry signals wisely, we also need to be mindful of the stocks we allow into our farm list. Look for stocks that have smooth, deliberate price action. Price is telling us a story and needs to be easily readable. 

Price should respect support, resistance and trend. A stock chart filled with long wicks and tails tends to produce a lot of gaps and is a chart to avoid. 

Trading is challenging enough without trying to trade something that is all over the place. Also banned from the watchlist are stocks with very low prices and those that lack sufficient volume. Remember, we are after consistency in profits and this is unlikely to occur if we trade stocks that show no consistency at all.

If you have been struggling as a trader or want to improve your win/loss ratio, I have a suggestion for you. Having confidence in your trading system is very important. To create that confidence, it’s essential to be very selective about the trades you take. Remember, Quality over Quantity!

To be selective, wait for the Volatility Stop to change from Red to Green. Once it is Green, evaluate the quality of the price action, trend, support and resistance that would be involved in the position. If the trade passes your rigorous evaluation, watch and wait for entry signals (buy signals) with stop-losses close at hand.  In doing so, you have the benefit of seeing buyers reacting to support and you also have a low-risk trade if it fails. Always remember, there is no need to rush. Make the trade come to you!

Manage the Watchlist Daily

At least once every day flip through your watchlist watching for potential new entries. If a chart breaks the trend, remove it from the list and work to replace it with another trending stock. Farmers plant seeds and continually tend the crop removing weeds and fertilizing to maximize yields.Consider your watchlist as your farm and work diligently to tend your crop. Consistent profits are possible if, and only if, your crop is carefully managed. Fail to do this important job, and your potential gains will disappear as your crop dies.

Never Miss Another Trade

If you have the luxury of watching the market during the day, consider using Price Alerts. When I’m going through my watchlist, I am always on the lookout for trades that could be setting up. By placing Price Alerts on my charts, I am quickly notified when a stock price crosses a potential entry price. I have plenty of time to plan and evaluate the potential position long before the actual entry occurs.

Traders unable to watch the market can make use of conditional orders. I used conditional orders consistently when I was still working full-time. I would do all of my charting in the evening; placing orders and adjusting stops for the next day. As I was unable to check the market during the day, my next look at the charts would not be until the following evening. It’s not easy, but it is possible. Trust me, if I can build an account doing it, anyone can!

Avoid Temptation

Avoid the temptation to over-complicate. The old saying “If it ain’t broke, don’t fix it” applies well here. As traders, we are easily tempted by the next shiny thing that catches our eye. It starts off innocently, trying small tweaks but, before we realize it, we have fundamentally destroyed a perfectly good system.

Simplicity is a good thing! Simplicity works, as long as we don’t allow our big brains to get in the way. Even after all these years, I have to guard myself against changing up what has worked so well for me. Resist temptation and keep it simple!

Basic Rules

1. Always trade with the Direction of the Overall Market.

2. Only trade stocks moving with the Overall Market Direction.

3. Buy stocks that are AT or NEAR price support…with a buy signal.

4. Sell stocks that are AT or NEAR price resistance.

5. Never enter a trade without an exit plan.

6. Always know the exact amount of money at risk…acknowledge and accept this risk.

7. Make sure the potential Reward is greater than the Risk.

Do not trade if a single one of these rules is broken!
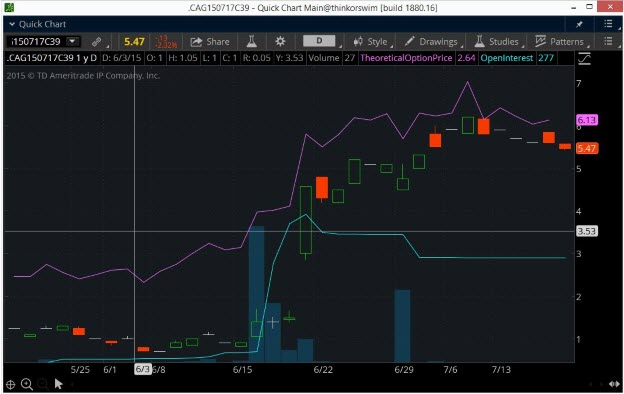
Option Traders

Because this strategy capitalizes on directional movement, it easily lends itself to the options trader. Obviously simple Call and Put contracts are useful but other directional option strategies can be used.

Debit Spreads, Credit Spreads and Calendar Spreads are all viable choices, depending on your risk tolerance. Iron Condor traders should consider legging into the position to increase the odds of winning on both sides of the spread. Longer term option traders will find LEAPs  to be very profitable, as well as a Fig Leaf position.

I like to use conditional stop orders based on the price of the underlying stock. The Volatility Stop Indicator helps me enter option trades with low-risk and provides an easy method of managing the position mechanically. 

Free Bonus Pack

Get the TC2000 34EMA Trending Easy Scan Code PDF, Building a Qualified Stock Scan for TC2000 PDF, Think Or Swim Volatility Stop Indicator Setup and Code PDF. Download Bonus Pack

THE SPECIAL OFFER

Build your trading foundation, get daily updates to help you size up the best opportunities, and never miss a trade again with our email trade alerts. Join us today and get a 30-Day Trial Offer for both Hit and Run Candlesticks and Right Way Options live trading rooms, daily videos, and trade alerts!

ABOUT THE AUTHOR

Author: Doug Campbell, Founder
Company: Right Way Options
Website: RightWayOptions.com 
Alternate Website: HitAndRunCandlesticks.com
Services Offered: Trading Room, Email Alerts, Training Videos, Webinars
Markets Covered: Stocks, Options, Day Trading, Swing Trading

Doug Campbell has been trading for more than 25 years and has been a full-time educator and trading coach for over ten years.

Chapter
10

THE SECRET PATTERN THAT PREDICTS EXPLOSIVE MOVES

By Geoff Bysshe, MarketGauge.com

Why do so many traders struggle to consistently build their account?

There are several potential reasons traders struggle, but many of the reasons are related to the fact that traders are usually trying to assimilate too much information.

Plus, often, the information they’re using is just plain bad!

If you’ve ever felt overwhelmed or confused in your analysis of the market’s trends, then you know what I mean… And you’re not alone.

Information overload is not your fault!

In fact, you may have your trading platform and the trading industry to blame.

Fortunately, the solution to become clear, confident and consistent in your trading does not have to be difficult.


Before we jump into the pattern that you really need to know, I want to give you a quick reminder to check out my ix10 Pattern—It’s a strategy we have been trading for decades with unbelievable success and we have a 90+ percent discount to grab it now for those that downloaded this eBook.

Just Tap Here to Learn How to Get the Complete Strategy


Look at the chart below filled with indicators.

Are your charts filled with indicators?

Does all of this information really make you a better trader? Is it really making you money? The answer is probably “no”.

Trading platforms have made it too easy to load up your charts with information that does more harm than good.

Markets can be complicated, but trading shouldn’t be.

Successful people, and successful traders have the ability to make complicated things simple.

“Complexity is your enemy. Any fool can make something complicated. It is hard to keep things simple.”

- Sir Richard Branson, founder of Virgin Group

One of the most widely respected authorities in the field of developing trading systems is Van Tharp. In his book, ‘Trade Your Way To Financial Freedom’ he says...

“Simple concepts work the best in system design. Simplicity works because it tends to be based on understanding rather than optimization.”

Van Tharp

Simple trading strategies usually work the best, because they are easier to trade consistently, with fewer mistakes, and less stress related to ‘analysis paralysis’ (information overload).

Success in trading comes from being methodical and keeping it simple.

The best way to achieve both simplicity and a methodical, rules-based approach to trading is to start with a simple pattern that identifies a market condition which leads to an outcome you can expect and trade.

Mastering this one pattern can be as simple as knowing where to draw two lines on a chart!

Yes, it can be this simple (and we’ll show you how).

Here’s what that picture above means.

If I could show you how to look at a chart, and

  1. Draw 2 lines
  2. Be a buyer over the top line
  3. Place a stop loss under the bottom line
  4. Take profits at the 3rd line

Would that simple process help your trading???

You’ll find trading much easier if you simplify your trading criteria down to just a few rules and just TWO or THREE Price Bars!

Before you call me crazy, let me explain how it can be done.

We’ve been doing it for decades.

Every day, I follow a simple plan that you can also do!

  1. I find a handful of stocks that are set up for the next day.
  2. I glance at them during the day to see if they are following my plan.
  3. I add to my portfolio when I need more trades.
  4. I occasionally day trade them for higher profits.

This is easy to do, and you can do it too, even as a part-time trader.

Using Simple Patterns Increases Your Trading Discipline, Confidence and Profits

One simple pattern can give you a complete trading plan that allows you to effortlessly increase your trading discipline.

Additionally, identifying which stock with the pattern or setup will work best, can be as easy as knowing the best ‘location’ in the trend to trade. You can also easily determine where to place stops and take profits based on a simple formula that works on most trading systems.

Why This Pattern Works So Well

In the quote for Van Tharp above you learned that, “Simplicity works because it tends to be based on understanding”.

The understanding behind this pattern is this simple market truth…

“Price compression leads to explosive moves”

If you can identify good price compression then you can anticipate and trade the trend that always follow it.

What is Price Compression?

The highlighted boxes show 3-5 day periods of sideways action with well-defined support and resistance. In this example, the price compression is defined by several bars that share similar daily high and/or low prices.

Where you can draw a box by connecting highs, and connecting lows. You have compression.

IMPORTANT… you can have periods that do not have easily defined compression.

These are conditions you want to avoid trading.

NOTICE… When you can identify periods of price compression, they are then followed by significant breakout moves that often lead to substantial trends.

The ebb and flow of market action that moves from choppy or trending to then compressions, and then back to trending is a natural rhythm of the market that you can profit from!

Plus….

There is an easier way to identify price compression that you can trade with a simple methodical approach.

Your Simple 2 Day Pattern

Here’s a 2 day pattern that identifies price compression that you can use to trade with a few simple trading rules for entries and exits.

Don’t mistake its simplicity as a weakness. It’s powerful.

This pattern is commonly referred to as an “Inside Day”, so you may have heard of it, but the power is in how and when you use it.

This simple pattern or ‘setup’ will help you solve the following trading problems:

  • It defines your entry level and exit level, so you know where you will get in and out of the trade before you get in!
  • Once your entry is triggered you know how the market should act. It should trend. This means you know when your trade is working!
  • Understanding how well your trade is working leads to:
    • Easy trade selection
    • Less stress
    • Catching the “easy” trades
    • Easily controlling your risk

This Setup: Trend Continuation Inside Day

Can you see how easy that pattern was to spot, without any special software? Again the “Inside Day” Pattern rules are very easy to follow:

  • Super easy to find (no indicators required)
  • They are the perfect example of market compression that leads to expansion (big trend moves)
    AND…
  • You know exactly when the big trend move should begin – when the high of the inside day is broken.

How can you tell which “Inside Day” patterns will work the best?

The answer is knowing the best “location” in the trend to trade. What we want is to catch the next move up or down in a major trend. We want the bigger trends to be in our favor – both daily and weekly.

The daily chart setup indicates when and where the major trend is about to continue after a rest or correction.

First, we must define the “Trending Market”.

A simple and effective way to define a trending market is to identify when the market is above the 10 DMA, 50 DMA and 200 DMA for an uptrend.

What about your stop/loss, and where do you take profits? Just keep it as simple as possible, and you’ll be amazed what that does for your trading confidence.

When you trade based on a pattern, the best place to have your stop is where pattern has been broken. This means you can easily determine where to place your stops without any complicated analysis!

  • Entry trigger = over the inside day high
    • You may roll up to the outside day high if it’s close
  • Initial stop = Under the low of the pattern, so under the low of the outside day.

As you’ll see in the examples below this pattern is very powerful in widely traded stocks as well as little known ETF!

In this example below, Facebook (FB), demonstrates how the Inside Day can identify the end of a market pullback. After the Inside Day breakout it marched $12 higher in just 12 days.

In this little known ETF below, Global X Lithium & Battery ETF (LIT), you’ll see that it exploded higher by over 10% in just 4 weeks.

In the example of First Solar (FLSR) below you’ll see how the Inside Day provided a way to enter into a breakout early and with defined risk. Then it exploded 19% higher in just 19 days.

In this brief report, you have now learned a simple pattern that allows you to:

  • Identify a specific pattern within a trend
  • Your trade is defined by a daily high and a daily low
  • You can easily set your stop/loss and profit targets with basic parameters,

Keep it simple, and throw away all of the complicated stuff. You will be far more relaxed and confident in your trades.

THE SPECIAL OFFER

If you’d like to dramatically increase your ability to use this simple pattern, then let me show you my ix10 Strategy.

It’s my favorite technique for leveraging the Inside Day setups and I have been using it for almost 30 years (!!) to take advantage of the market.

For just $7 bucks I am giving away the entire strategy to those that have read this report.

Learn all the details and take advantage of the full strategy here

ABOUT THE AUTHOR

Author: Geoff Bysshe, Co-Founder
Company: Market Gauge
Website: MarketGauge.com
Services Offered: Trading Education, Market Commentary, Trade Alerts
Markets Covered: Stocks, ETFs, Options, Futures

Geoff Bysshe, co-founder of MarketGauge, began trading in 1990 on the floor of the NY commodities exchanges. He spent several years as an independent floor trader.​

Chapter
11

The 3S CODE: My #1 Chart Pattern for Trading Seasonality

By Seasonal Swing Trader, SeasonalSwingtrader.com

Before we begin, it is important to note that it is not imperative that this pattern is used to trade seasonality alone…in fact, it can be used to trade any time frame and any markets where seasonality may not even come into play.
 
For example, seasonality is not going to come into play on 5m chart of the Nasdaq, or a 30m chart of some cryptocurrency…hopefully you get my drift.  
 
In addition to the above statement, you can even swing trade stocks,  options, ETFs, commodities and the like ​without taking seasonality into account.  
 
So, this FREE report should be beneficial to those that are looking for a very reliable, high-probability pattern and setup to add to their trading arsenal, as       well as those that want to learn how to incorporate this powerful pattern along with seasonality to help put odds in their favor. 
 
Let’s get started…. 
 
In this free report, you are going to learn how to trade historically reliable seasonal patterns AND coupled with historically reliable chart pattern analysis. 
 
When you combine the two together, any trader can put significant odds in their favor to capture seasonal trends and project moves as dictated by simple chart patterns.  
 
Drumroll...Here is the Setup! 

This pattern is sometimes referred to as the (A-B-C) Top/Bottom. It anticipates a change in trend from up tp down on a break below the “2” or “B” point. It anticipates a change in trend from down to up on a break above the “2” or “B” point. It is because the market fails to make a higher high or a lower low….the market is exhausted and ready to turn the tide so to speak. 
 
Generally speaking, the more bars it takes to complete the pattern, the bigger the move, and the more accurate the signal will be. Again, confirmation of entry is on a break OR close above or below the “2” point. 
 
1) Exit strategy #1 is the distance between the “1” and “2” points

2) Exit strategy #2 is the 50% retracement level

3) Your RISK is ​above​ the #1 or #3 points for short trades

4) Your RISK is ​below​ the #1 or #3 points for long trades 
 
 Let’s look at some examples to put this into context: 

• #1 point put in at 52-week high

• Prices moved lower to establish #2 point at support

• Market rallied but failed to make new highs, making our #3 point

• Confirmation sell triggers on break and close below the #2 point

• Reached profit objectives within approx. 20 trading days 
 
As I said earlier, we can trade this setup (“pattern”) on an intraday basis as well - see below a 5m chart of the ES (Emini SP 500).

• #1 point put in at session high

• Prices moved lower to establish #2 point at support

• Market rallied but failed to make new highs, making our #3 point

• Confirmation sell triggers on break and close below the #2 point

• Reached profit objectives within 10 minutes 

Here are a couple of examples of the 123 Bottom - same rules as the 123 Top but inverse. 
 
See this Daily Chart of Lean Hogs


• #1 point put in at 52-week low

• Prices moved higher to establish #2 point at resistance

• Market sold off but failed to make new lows, making our #3 point

• Confirmation buy triggers on break and close above the #2 point

• Reached profit objectives within 7 trading days 
 
And this Weekly chart of AAPL 

• #1 point put in at multi-week low

• Prices moved higher to establish #2 point

• Market sold off but failed to make new lows, making our #3 point

• Confirmation buy triggers on break and close above the #2 point •Reached profit objectives within 10 bars (weeks) 
 
Okay, so by now you should be able to see how this very simple pattern works on any market and any timeframe.  
 
Let’s take a quick glance on how to incorporate with seasonality. Below is a Daily Chart of Hess Corp (HES). I have used drawing tools (yellow “1-2-3”) to illustrate the 123 bottom that formed in August. ​Note: My 3S CODE indicator also painted the 123 bottom on the chart automatically as indicated by the green (1), red (2), and blue (3) arrows.

We have also added a free study that is included in the ThinkorSwim platform - the Seasonality Indicator   

**To add, go to top right-hand corner of chart, select the 3-bar “sandwich” button, go to Style>Chart Mode>Seasonality. The turquoise line is the actual price and red line is the seasonal price average. 
 
So if we take a glance at what HES does on a historical seasonal basis, you can see that HES typically experiences strength in the late August /early September time period. This helps us with further confirmation on getting long, since we also have a 1-2-3 bottom formation taking place. 
 
Once the price broke above the most recent red arrow (the #2 point), that was a trade confirmation. A more conservative entry is to wait for a solid close above the breakout point (#2), or wait for a retest of the breakout area - which we got both. Then, as you can see, the profit target was  reached in approximately 10 trading days. Again, you know BOTH your profit and risk beforehand, and you can place your orders accordingly. 

This trade was good for a little over $4.00, or $400 per 100 shares traded. 

A trader in this example could have: 
 
1) Bought the stock

2) Bought call options or call spreads

3) Sold put spreads 
 
Let’s take a look at one more example - this is a daily chart on Live Cattle (/LE):

Here, we have a 1-2-3 Top formation that formed in May. From a seasonal perspective, we also know that the Cattle market tends to “top” out during this time period, thus indicating we have a high-probability trade at hand. 

Approximately 3 months later, Cattle reached its profit objective of 13 points at 107.65, which is $5200 per single contract traded.  
 
This is a trade that can be replicated by shorting Live Cattle futures, buying puts or put spreads or selling call spreads. 

THE SPECIAL OFFER
 
We thoroughly hope that you have enjoyed this report and can see the importance of adding the 123 top and bottom pattern coupled with seasonality as part of our overall trade plan. Whether you are a stock, futures or options trader, Seasonal Swing Trader has a trade idea for you. 
 
If you’d like to see more examples, you may be interested in checking out this FREE presentation below! 
 

ABOUT THE AUTHOR

Author: Seasonal Swing Trader
Company: Seasonal Swing Trader
Website: SeasonalSwingTrader.com
Services Offered: Weekly Trade Ideas, SMS Alerts, Analysis
Markets Covered: Stocks, Options, Commodities Futures, Currency pairs

SeasonalSwingTrader identifies historical seasonal trends and market cycles on up to 40+ years of historical market data and delivers quality, actionable trade ideas that put probability in your favor.

Chapter
12

Know When Options are Cheap and When They're Expensive

By Eric Wilkinson, ProTraderStrategies.com

Understanding options pricing is paramount to the success of any strategy.  This avoids the pitfall of buying premiums when they are at extreme highs or selling options premiums when they are at extreme lows (don't buy high and sell low).  In this video, you will learn about volatility and simple steps that will lead you to when it is the the right time to buy options and where one should sell options to increase ones probabilities of success.

Join Eric "The Wolfman" Wilkinson, former Chicago Board of Trade floor trader and 25 year professional trader, as he explains how traders can use his rules to discern what options strategy is best suited to meet the directional assumption of the trader. Ultimately,  Eric will show a simple way to find the best environment to trade options.

THE MOVIE: KNOW WHEN OPTIONS ARE CHEAP AND WHEN THEY'RE EXPENSIVE

THE SPECIAL OFFER

Get the Wolfman Special Options Trading Course by clicking on the button below.

ABOUT THE AUTHOR

Author:  Eric Wilkinson
Company:  Pro Trader Strategies
Website:  https://www.protraderstrategies.com
Services Offered:  Trading Schools and Trading Strategies
Markets Covered:  Futures, Stocks, Forex and Options

Eric "The Wolfman" Wilkinson is a veteran floor trader and has been trading financial futures, commodities, stocks, stock indices and options on a variety of products for over 20 years. He has been sought out by several media outlets to debate against some of the brightest minds in the industry, where he debates on topics ranging from economics, geopolitics and market directions.

Chapter
13

The J-Hook Continuation Pattern

By Rick Saddler, HitAndRunCandlesticks.com

While there are a number of continuation patterns in trading, the J-Hook Continuation Pattern is one that is a very decisive and can be easily identified since it forms the letter J.  If the chart pattern is followed, entered at the right time and unfolds as expected, it can be very profitable.  J-Hooks may also called by other names like Thunderbolts and 123 formations.

There are three basic parts to the pattern 1) a strong upward move in price 2) a pullback and 3) an up move which should continue into a breakout above the previous pivot high in price to complete the pattern and continue the uptrend.  Figure 1 presents the three price movements that take place as a J-Hook develops. 

  1. Price moves rapidly with a strong upward move in price.
  2. Price begins to pull back forming a small cup that is its signature move during the J-Hook pattern development. The pullback can be divided into three parts as follows:
  1. Price begins to pullback with lower highs, which is the start of J-Hook formation.
  2. Price establishes a low with several candles, possibly close to a support line.
  3. Price moves up toward the previous high and can meet resistance at this point.

Price breaks out above the previous high to continue the uptrend in price.

Figure 1:   The three sections of a J-Hook Continuation Pattern

J-Hooks are very easily spotted once the pattern is learned.  There are no hard and fast rules about the exact shape and minimum number of days for each candle to reside in the three separate phases of the    J-Hook Pattern.  Rarely will you see a perfect J-Hook and continuation move up that goes in a straight line.  There are some patterns that can be confused with J-Hooks as not all patterns are as clear and concise as the model depicts.  Study the charts that follow:

  • Valeant Pharmaceuticals (VRX) shows a relatively clear and easily identifiable J-Hook chart pattern in Figure 2. 

Figure 2:  A completed J-Hook Continuation Pattern showing price movement

  • U.S. Steel Corporation (X) chart shows a much longer uptrend and a deeper pullback in Figure 3.

Figure 3: A Deep and Extended J-Hook

  • Twitter Inc (TWTR) in Figure 4 has formed a J-Hook with an upward thrust that diverts from the normal accepted path of a J-Hook at two different times.  It pulls out of the upward trend for about three days and then resumes its ascent until it starts to pull back forming a cup shaped structure. Price has moved above the previous high with a possibility of moving up.

Figure 4: A J-Hook that deviates from its upward path.

The J-Hook Continuation Pattern provides no guarantee that price will move into the high probability zone, no matter how perfect the configuration. The chart on X in Figure 3 is an example of a very clear J-Hook but may be too deep and extended for some traders while acceptable to others.  The same is true of Figure 4 where not all traders would be willing to accept the pattern as a J-Hook.

Progression of a J-Hook

The following movements in a chart pattern are a must for it to be called a J-Hook. 

  1. Price action shows a strong upward trend in progress.
  2. As sellers begin to take profits at the pivot high of this move up, the upward move is interrupted causing price to pullback. 
  3. As the selling process slows down it reaches a low point, a place of consolidation (the bottom of the cup). 
  4. Price action begins to turn up and move higher as buyers begin to purchase, confirming that the pullback is over.
  5. Price action moves in an upward direction again and, as price breaks out above the prior pivot high, it continues to move in the upward direction completing the J-Hook Continuation Pattern.

In the Red Hat Inc. (RHT) chart below, Figure 5, it is in an uptrend, but will pullback or reverse the trend when sellers enter the scenario.

Figure 5: J-Hook Pattern and Price Movement into the High profit zone.

The key to recognizing a J-Hook Continuation Pattern is not just the initial upward move in price, but also the patterns that preceded the move.  The greater the number of positive signals prior to the J-Hook formation, the stronger the probability of an upward swing.  The pattern becomes more forceful if the initial move up appears after a Morning Star or Bullish Engulfing Candlestick Pattern, a double bottom, and other positive signals and patterns. See Figure 6 below.  

Figure 6:  Longer term chart pattern shows multiple positive conditions leading up to the J-Hook

Sometimes J-Hooks form above the support line with the pullback testing support.  When this happens consider it an added strength that raises the probability of a move higher.  This may take it further into a higher probability zone; if the pattern works out, it may offer more than the expected gain.  See Figure 7 on RHT below.

Figure 7:  J-Hook forms with a pullback to the support lines

Using Different Time Frame Charts

We all want charts to move up in a steady straight line, but that does not always happen and price will pullback providing another buying opportunity.  The back and forth movement can compromise the clarity we expect to observe. Many times, on a daily chart, this price action will make the underlying chart formation harder to recognize.   

I have, personally, found it more successful to use the Daily Chart.  However, a 2-day or 3-day chart may offer a clearer picture by eliminating indecisive candles and providing a better understanding of the underlying price action. Your reason for looking at longer time frames may range from being a longer-term trader or eliminating the noise on a lower time frame.

If used correctly, there are the advantages of using various time frames:

  1. A cleaner picture of what is happening to price action as it moves.
  2. Support and resistance may be seen that is not evident on a daily chart. 
  3. Recognizing a pattern that may not be obvious at first glance on a daily chart. 

Compare the Extended J-Hook daily chart on X in Figure 8 to a 3-day chart in Figure 9 and see how it displays clarity and is easier to observe. A great reason for checking out multi-day charts is to get a cleaner picture of price action that is easier to observe and understand.

Figure 8: An Extended J-Hook on a Daily chart of X

Figure 9:  A J-Hook 3-day chart of X eliminates noise

Entering a J-Hook Trade

The J-Hook Continuation Pattern is a move upward in price, a pullback and a continuation of the movement in the original upward direction as described in the sections above.  

There are four suggested areas for entering J-Hook trades.  It is always important to know that profit is not made while the pattern is in progress, but after it completes and signals that buyers are stepping in and price resumes its upward movement.  This does not mean that shorter term trades within the pattern are not possible.  Swing traders may prefer to enter the trade as the pattern develops. The four entry areas are listed below.  See Figure10.

Figure 10:   Four places to enter the J-Hook Continuation Pattern

Area 1:  Price reaches a low and consolidates with a higher low or a candlestick buy signal

Area 2:  Price is between Areas 1 and 3 where buyers can enter.

Area 3:  Price reaches the same level as the previous high.

Area 4:  Price breaks out, moving toward a new high, continuing in the original upward direction.

It is important to note that no one area is better for entry than the other.  Where you designate your entry point is a matter of personal preference. If you chose to enter at Areas 1 and 2, the probability is that you are not planning a very long-term trade.  You may want to get out at the first swing, which could be an exit at the resistance line, when price reaches the previous high.  On the other hand, if you can manage the trade all the way up for a bigger percentage gain, Area 4 may be your personal choice.  The larger profit is usually made after the chart pattern has completed. Your entry and exits should be planned with stops to preserve capital.

As a student of the Market, you may ask the question, “What should I do?”  The answer is “Be vigilant” and train your eyes to follow the chart and determine if the probability of success exists.  Remember the importance of being aware of the possibility of a J-Hook forming before, during formation, and after it has formed.  When you see the possibilities, it becomes a watch list candidate.  It will give you opportunities of entering the trade in Areas 1-4 as it moves along.  Some words of advice once again are, “Make sure you trade with a plan in place.”

All J-Hooks have an initial move up in price; however, it is unknown whether it will turn into a J-Hook as it moves.  At some point price it will start to pullback, bottom out, and turn up moving toward the previous high.  If it fails to do so and breaks a support line, it is no longer a J-Hook. 

A good way to estimate the pullback in price action is to use the Fibonacci retracement lines. Draw the Fibonacci lines on the initial upward move of the chart and determine if any of the retracement lines coincide with the lowest area of the pullback.  You can use the following as a guide to estimate the progress of the pattern as a J-Hook.  

  1. A 23.6% retracement line is my favorite for this pullback. 
  2. Between 23.6% and 38.2% retracement, the area can still be a good entry section.
  3. Below 38.2% is a gray area to be entered with a lot of caution.
  4. Below 50% the chart pattern can no longer be placed in the J-Hook category. Due to such a deep pullback, it pulls price out of the short-term swing trade range.

Check out the Sandridge Miss Trust II (SDR) chart Figure 11 below; at first glance it appears to be a great J-Hook, but price continued to move below 50.0 % and far beyond.  The blue arrows show an ideal formation of a J-Hook chart pattern.

Figure 11:   A deceptive J-Hook that ends up as a four-candle pullback.

There are no guarantees that a chart pattern will succeed or fail with the use of Fibonacci retracement lines.  It may not fully develop into a J-Hook but if the upward trend has not broken, it may still be worthy of keeping its position on a watch list.

Many high probability trades are missed because of what we think are “chart pattern failures,” so we, as traders, “fail the chart.”  We simply neglect to follow the chart and keep it on our watchlist.

Observing Failed J-Hooks

All charts can fail at any stage of the J-Hook formation before or right after the pattern completes.

You may anticipate the development of a J-Hook on a chart that shows promise, but it may not materialize and ends up with a failing reversal pattern.  It can also reach the previous high and form a double top or reverse at any point and no longer reach the profit zone.  The Sprouts Farmers Market (SFM) chart shows a J-Hook that failed prior to reaching the previous high.  See Figure 12 below.

Figure 12:  A Pattern that failed to complete the J-Hook and enter the higher profit zone.

In the US Steel Corp (X) Figure 13 below, the J-Hook failed to move up very far after the breakout even though the chart pattern is still above the bullish trendline. 

Figure 13:  A chart pattern that failed to complete the J-Hook and enter the higher profit zone.

As traders we need to keep in mind that “patience is the name of the game.”   Most of the time we give up on a failed chart pattern if it pulls back more than what our plan dictates, and we spend too much time regretting and dubbing it as a “failure.”  There are hundreds of charts that can be found even in a down trending market.  If you are a struggling trader, it is always best to trade with the trend of the market and not against it.

In Summary

The J-Hook Continuation Pattern is one that I have personally traded for many years.  It takes time to become familiar with the pattern and understand the price movements within the pattern that have proven to be most successful over the years.  The details of the J-Hook Continuation Pattern that are shared in this write up are what I have found worked best for success.  I wish you great success as you learn these details and incorporate them into your own trading program.

THE SPECIAL OFFER

To find out more about the J-Hook Continuation Pattern and other patterns we use in the Hit and Run Candlesticks and Right Way Options Trading Rooms on a daily basis, join us for a 30-day free trial to both rooms.  The Hit and Run Candlesticks Trading Room is open Monday through Friday 9:00am to 4:00pm ET and Right Way Options Trading Room is open Monday through Friday 11:00am to 1:00pm ET. 

ABOUT THE AUTHOR

Author: Rick Saddler, Founder & CEO
Company: Hit and Run Candlesticks
Websites: HitAndRunCandlesticks.com, RightWayOptions.com
Services Offered: Live Trading Room, Trading Education, Software
Markets Covered: Options, Futures, Stocks, 

Rick Saddler has 29 years of experience coaching traders to enter with low-risk on short-term trades, grabbing profits and sleeping well at night. His bottom line has become simplicity equals success.

Chapter
14

CAPITALIZING ON MARKET MOVES WITH NEWS TRADING

By Charles Comber, SlickTrade.net

A Simple News Straddle Trading Strategy for Forex & Nadex

When it comes to trading the forex market, many strategies do not suggest traders using them during high impact news releases. Two of the highest impacting news releases are FOMC and NFP, and they create a high level of volatility within the market. Many traders get “trapped” in positions during these releases, in hopes of the market returning to their favor, or gain large if they are in the correct direction of the move already.

I’ve been using a simple strategy to trade these events and it can be used for both the forex and Nadex platform. If used with a trail stop, then you have the opportunity to enjoy large gains, but even if the trader simply sticks to the bare minimum gains, this is another great addition to your monthly trading plan.

VIDEO PRESENTATION

What is FOMC?

The Federal Open Market Committee (FOMC) is the team behind the US Federal Reserve that controls the nation’s cash supply through open market operations.

What is NFP?

Non-Farm Payrolls also known as NFP, is reported monthly by the US Bureau of Labor Statistics to give a timely glimpse into employment changes inside of the United States.

What does it mean to “Straddle”?

Straddle trades are so called because they have two separate legs that sit either side of a given price level. More often than not, straddle trades are used to trade breakout events.

News Trading Straddle Strategy

This simple to follow strategy helps to keep the emotional aspect out of your trading by setting your trades up before the news release and letting them ride out their course. By using the straddle method, the trader protects their capital and has the opportunity to gain from both sides, in the case of a consolidated move.

RULES:

First Entry

  • 15 min timeframe
  • Load charts approximately 30 minutes before the release
  • Look at the range of the previous 1-2 hours
  • Approximately 10-15 minutes before the release of NFP or FOMC, place 2 pending orders 10 pips above and below the defined range
  • Set TP levels of the approximate range size with a trail stop for maximum profit
  • Set SL roughly 20 pips below range high and 20 pips above range low
  • If first position reaches approximate range size TP, then cancel the other pending order
  • If first position does not reach TP, then leave the other pending order open to buffer loss

Examples

Second Entry

  • IF price spiked a minimum of 25 pips in one main direction from the release THEN,
  • Approximately 2 hours after the release, enter a trade in the opposing direction in which price spiked
  • TP should be initial price before news release
  • SL at previous support or a long or resistance for a short

For Nadex Traders Only:

  • If you only trade Nadex, you can also use this strategy by entering two OTM trades approximately 10-15 minutes before the news release in opposite directions
  • Risk - $10-15/contract
  • TP at $10-30/contract
  • Once the TP is hit on one side, cancel the opposing trade

This strategy works best on the major USD pairs

AUDUSD

EURUSD

GBPUSD

USDJPY

USDCAD

USDCHF

THE SPECIAL OFFER

Charlie has a special offer for you for attending this presentation! Get Your 3-Part Video Series "Pure Price Action for Profit" for free. Pure Price Action for Profit is for both newbie and seasoned traders who wish to enjoy the skill of reading, understanding, and projecting future price movements without relying on magical indicators. Going back to the basics and learning to confidently read the charts will result in steady growth and your success as a trader. You'll be sent parts 1, 2, and 3 of the Pure Price Action for Profit video series. We'll also share an exclusive, time-sensitive offer, along with details on how you can receive the rest of the price action video training series at No-Cost.

Along with receiving the 3 part video series, you will also receive the template shown in this presentation for your Meta Trader 4 and a special 15% lifetime discount code for the Sapphire Membership offered from Slick Trade Academy (Please note the discount is for new members only).

ABOUT THE AUTHOR

Author: Charles Comber, CEO and Founder
Company: Slick Trade
Website: SlickTrade.net
Services Offered: Trading Education, Trade Signals, Expert Advisors
Markets Covered: Forex, Futures, Day Trading, Swing Trading

After years of successful trading, Charles created SlickTrade Online Trading Academy because he knew there was an alternative to so many other services that were not truly helping others to learn how to be successful at trading different financial assets.

Chapter
15

How to Screen for Top Candidate Stocks

By Mary Ellen McGonagle, MEMInvestmentResearch.com

This short video reviews how to drill down to uncover top candidates that are poised to outperform the markets. The concepts that are introduced are based on a proven system that was developed following many years of researching the common characteristics of winning stocks.

In addition to learning how to spot top stocks, you’ll uncover how to pinpoint your entry point by buying these winning stocks as they pullback to key areas of support.  Even more important, this video covers how to exit the stock so that you retain your profits and limit your losses.  There are many examples that are reviewed in detail to help you in your trading.

THE MOVIE: HOW TO SCREEN FOR TOP CANDIDATE STOCKS

THE SPECIAL OFFER

Click below to get my eBook on how to profitably trade momentum stocks.

ABOUT THE AUTHOR

Author: Mary Ellen McGonagle, Founder
Company: MEM Investment Research
Website: MEMInvestmentResearch.com
Services Offered: Market Analysis, Market Reports
Markets Covered: Stocks, Options, Futures

After advising high-flying, top portfolio hedge and mutual fund managers over 20 years, Mary Ellen is turning here attention to independent investors.

Chapter
16

Using Futures as an Indicator

By Geoffrey A. Smith, DTItrader.com

By now, most people who pay attention to the financial markets realize that what happens in Asia and Europe will affect our market here in the US. How many times have we woken up in the morning to hear CNBC or Bloomberg telling us that the European markets are down 2%, that futures are pointing to a lower open, and markets are below fair value? We now live in a global economy; what happens overseas will drive our markets higher or lower depending on what occurred while we were sleeping. This causes the S&P 500 cash, Dow 30 cash, and NASDAQ 100 cash indexes to gap up or down at the US open. If you are on the right side of the market, this could be a good thing, however, most feel the pain as the bad news drives the markets lower.

There are over 10,000 stocks that are available to trade in the US. Many of our companies in the US are global companies, doing business overseas as well as at home. And like our companies, there are many companies overseas that do business here in the US. We can trade those companies’ stock on our exchanges. We call them ADRs (American Depository Receipts). Asia and Europe trade our stocks on their exchanges just as we trade their stocks on ours. We can buy Toyota Motor Corp (TM – Japanese), Siemens (SI – German), and Baidu (BIDU – Chinese) on our exchanges here in the US. These are foreign companies (stocks) traded on our exchanges. Likewise, our stocks trade on their exchanges. Turn on Bloomberg or CNBC early in the morning and watch the ticker of the stocks “during European trading”. Though, unless you have an account in Europe you cannot trade them, it is nice to be able to see what the stocks are doing before we get the US open. It is easier, however, to watch the index futures, and they will tell you what the majority of stocks are doing instead of each individual stock that goes across the ticker on TV.

If the stock (the company) is a blue-chip stock or a well performing stock, it is put into an index to help gage the overall market. The cash indexes are a current (live) representation of the stocks that are in them. The cash indexes show the current value of the index only during the NYSE trading hours (09:30 – 16:00 ET). This means that during a 24-hour day, the cash indexes are “calculating” for 6 ½ hours of the day, or 27% of the time. That leaves 73% of the time that the cash markets in the US are not representing what is happening around the world. This time gap is what causes our markets in the US to gap up or gap down at the open because our stocks have been traded at the exchanges around the world and have been pushed up or down during overseas markets. The cash indexes here in the US “don’t see” that movement until the cash open in New York. This leaves the need for an indicator that tracks the markets 24 hours a day. 

The first markets to open are the Asian markets (including Australia, and New Zealand). They will control the market from 18:00 – 03:00 ET. This is when Europe opens, and so Europe will control the market from 03:00 – 09:30 ET.  Since the S&P 500, Dow 30, and NASDAQ 100 “belong” to the US, the US takes over at 09:30, however, Europe is still open and trading for the first 2 hours of our market. During the US markets, we still have European influence during our morning session. Once we get back from lunch, just the Americas are left to round out the 24-hour day. But no sooner do we close, and a new day is starting over in Asia. Talk about a busy day, and we still must find time to eat and sleep.

Since the US is most closely “related” to Europe, one of the largest influences on our market is what happens in Europe. Germany is the largest economy in Europe, and they have an index call the DAX Extera Index that is much like our Dow 30. It consists of 30 stocks, and they are Germany’s large industrialized companies. You have probably heard of many of them like Adidas, BASF, and Bayer to name a few. Half on them trade at the New York Stock Exchange as ADR’s. As we wake up here and begin to get ready for work, the DAX is already in full swing, giving us information that can tell us what our markets will be doing when they open.

Of course, Germany is not the only country in Europe. As we have seen in recent past, there are many different concerns in various other countries in Europe. And though Germany may be doing well, others may be having economic problems that the DAX index may not reflect. The Dow Jones Eurostoxx 50 is an index that looks at the 50 largest companies across the Euro Zone. It reflects the overall sentiment of the European countries. It will consider the movements of other European markets to give us a broader perspective of the economic status of European countries. These two indexes are open 03:00 – 11:30 ET. This encompasses most of our wakeup time in the US, as well as the first two hours of our day market.  In other words, Europe has been open for 6 ½ hours before we begin trading here in the US. But again, we ask, what are our stocks doing?  This is where futures come in.

Futures are a contract between a buyer and a seller. Futures look into the future to “lock in” a future price or try and predict where something will be in the future; hence the name. Most have heard of commodities. Commodities are a futures contract with a deliverable asset. For example: Let’s say that it is January and we are General Mills (GIS-NYSE) and we need to make flour for our Betty Crocker and Pillsbury brands. We need to buy wheat to make the flour. However, they are not harvesting wheat in January and we do not know what the price of wheat will be in June when farmers begin to harvest. So we meet with the farmer and make a deal that we will buy his wheat in June at $6.50 a bushel and he agrees. We have now locked in a future price and now can budget our year based off a fixed price. We will take delivery of the wheat in June after harvest.

There are also futures on indexes. Since an index is a mathematical calculation, there is nothing to deliver, and hence has not delivery. The index futures are a derivative of the cash index. Because there are futures on the cash indexes (S&P 500, Dow 30, NASDAQ 100, Russell 2000) that trade virtually 24 hours a day, we can watch the index futures to get a feel for market direction. The futures will move based off the section of the world that is open at that time. So, we have to divide up the 24 hour market into time segments to help us understand who is controlling the market. Remember, foreign exchanges are trading our stock, so in theory, our index is moving, but is turned off. If Asia is moving higher, we can look at the index futures to see if they are moving higher, and hence our stocks are moving higher.

The charts below are 30 minute charts of the S&P 500 futures(left) and the S&P 500 cash index (right). The Asian, European, and US markets are on the chart on the left. The futures opened and started trading higher in Asia, then began to weaken. Europe then opened and pulled the market down. The US then opened and began to retrace as Europe closed. Notice the gap in the chart on the right. Since the cash index is not calculating throughout the night, it ended the previous day, and gapped down since it did not track during the 73% of the time while it was turned off. 

                                             S&P Futures                                                                                       S&P Cash

Before the US cash market opened, it was known that Europe was weak and that the US would begin at lower prices. Notice the futures have no gap, and the cash does. This is what is referred to as a “gap down” at the open, yet there really was no gap based off how the futures traded. So, in this case, did futures lead the cash down? Not really. If the cash index was calculating throughout the night, you would see the same pattern. Some would say that the cash (stock) was down to “reconcile” it back to the futures. Again, no, because the stock had already traded lower in the European markets.

The same is true for the European markets. Again, the chart of the left is a 30-minute chart of the S&P futures and on the right is a 30 minute chart of the DAX.  Notice that the Asian markets surged around 22:00 (10:00pm) and continued higher during European trading. Since that DAX was closed during the Asian markets, it started higher when it opened (gapping up). But watching the index futures, we already knew where stocks would begin in Europe. The question would be, now that Europe is in control, will they push the market higher, or correct it back down based off their economic news.

Many discount what the markets do at night or totally ignore what happens because they think that the US is the only important market. In this day and age, all markets are intertwined from the simple basis of stock, as all foreign markets, including the US, trade stock from foreign countries. If we begin to look at the money exchange between countries, the pot grows even larger. 

We all have 401k’s and IRA’s that get moved around based off what the world thinks. And not paying attention to what is happening can be the difference between having an increase in account value or a decrease. It is our money, and we need to learn how to manage it. By simply watching what is happening around the world each week or weekend, we can begin to gain knowledge of what can occur to our account value. The funds in our 401k’s consist of stock. The performance of our funds depends solely on what the markets are doing. If we see the markets are trending higher around the world, we know we have a much stronger trend than if Asian and European markets are down most of the time and the US is the only one pushing higher. This may give us an indication of caution, and we can adjust our portfolios in case our markets begin to be pulled down by the world markets. This may also give us confidence to start entering foreign funds so that we can take advantage of their moves as their economies improve over the US. But as times get tough, we can move our monies into bond fund for protection and wait for the markets to turn around.

We don’t have to trade futures to understand what the markets are doing globally. Global markets move on news and it can be seen in the advancement or the decline in the index futures as stocks trade around the world. If we are wanting to know what the market will do when it opens at 09:30 ET, the index futures are one indicator that will give us the information we need as we approach that open. Though the market never sleeps, we don’t have to stay up all night wondering where stocks will be when we start trading in New York, all we need to do is look at the index futures and they will tell us where prices will be.

THE SPECIAL OFFER

TBUZ TV delivers the most critical market information for the day's trading. Straight to your email inbox before the cash market opens.

ABOUT THE AUTHOR

Author: Geoffrey Smith, Chief Instructor
Company: Diversified Trading institute
Website: DTItrader.com
Services Offered: Trading Education, Trade Alerts, Trade Rooms, Software
Markets Covered: Stocks, Options, Futures, Day Trading, Swing Trading

An active trader and investor for 25+ years, Geof focuses in futures, equities and option trading including trading commodity option futures. Geof took an instrumental role in developing the DTI Method. The Platinum Experience core level classes took first place in SFO Magazine and Trader Planet’s STAR awards in the best trading courses category.

Chapter
17

HOW TO CAPITALIZE ON VOLATILITY BY TRADING GAPS

By Melissa Armo, TheStockSwoosh.com

Learn one trading system that focuses daily on stocks that are gapping — and that take advantage of the volatility in the market

  • What it means to trade a GAP
  • How to properly trade volatility
  • How to make money shorting in the market
  • Why trading the Market OPEN is the best time of day to trade
  • Why following Institutional Money is very important

There has been EXTREME Market Volatility lately, and while challenging, Melissa has been making the calls with SPECTACULAR PRECISION!

THE MOVIE: HOW TO CAPITALIZE ON VOLATILITY BY TRADING GAPS

THE SPECIAL OFFER

We are offering exclusively to you, as a reader of this eBook, a special offer if you sign up for our Golden Gap Course. Contact melissa@thestockswoosh.com for details.

Also if you want a trial to The Stock Swoosh Show Live Trading Room, email info@thestockswoosh.com with 'Free Trial Request'in the title.

If you have any other questions or are interested in our course please contact us at info@thestockswoosh.com or call 929-3200-GAP.

ABOUT THE AUTHOR

Author: Melissa Armo, Founder
Company: The Stock Swoosh
Website: TheStockSwoosh.com
Services Offered: Trading Rooms, Trading Courses, Newsletters
Markets Covered: Stocks, Options

Melissa developed a system that capitalizes on the big moves that happen near the open of the market every day. She has an international business that informs her clients how to trade successfully utilizing her system.

Chapter
18

HIGH PROBABILITY, LOW RISK TRADE SET UPS BASED ON THE WYCKOFF VOLUME SPREAD ANALYSIS TRADING METHOD

By Gavin Holmes, TradeGuider.com

Most traders are aware of the two widely known approaches used to analyze a market- fundamental analysis and technical analysis. Many different methods can be used in each approach, but generally speaking fundamental analysis is concerned with the question of why something in the market will happen, and technical analysis attempts to answer the question of when something will happen.

Volume Spread Analysis, however, is a third approach to analyzing any market. It combines the best of both fundamental and technical analysis into a singular approach that answers both questions of 'why' and 'when' simultaneously.

Volume Spread Analysis (VSA) methodology takes a multi-dimensional approach to analyzing the market, and looks at the relationship between price, spread or range, and volume. VSA is a proprietary market analysis method conceived by veteran trader, Tom Williams, who was a highly successful member of a professional trading syndicate in the 1960s and also the creator of TradeGuider Systems. (www.tradeguider.com)

The VSA method works particularly well at highlighting the imbalances of Supply and Demand.

                Richard D. Wyckoff

VSA builds on the pioneering work of  Richard D Wyckoff, a famous 1920's trader. He based his trading decisions on supply and demand in the markets and how they are inextricably linked to professional activity - 'Smart Money' trading (Wyckoff's principles are still taught at the Golden Gate University in San Francisco). In any business where there is money involved and profits to make, there are professionals. Doctors are collectively known as professionals, but they specialize in certain areas of medicine. The financial markets are no different. The financial markets have professionals that specialize in certain instruments as well: stocks, grains, FOREX, etc. The activity of these professional operators, and more important, their true intentions, are clearly shown on a price chart if the trader knows how to read them. Volume is the major indicator for the professional trader.

                                                           What is the Big Money Doing?

Volume Spread Analysis seeks to establish the cause of price movements, and from the cause, predict the future direction of prices. The ‘cause’ is quite simply the imbalance between Supply and Demand in the market, which is created by the activity of professional operators. It is the close study of the reactions of these specialists, market makers,  professionals, or  “Smart Money‘’which will enlighten you to future market behaviour.

VSA looks at the interrelationship between three variables on the chart in order to determine the balance of supply and demand as well as the probable near term direction of the market. These variables are the amount of volume on a price bar, the price spread or range of that bar (do not confuse this with the bid/ask spread), and the closing price on the spread of that bar. For the correct analysis of volume, one needs to realize that the recorded volume information contains only half of the meaning required to arrive at a correct analysis. The other half of the meaning is found in the price range. Volume always indicates the amount of activity going on and the corresponding price spread shows the price movement on that volume.

The effect is either a bullish or bearish move according to the prevailing market conditions. The ‘Smart Money’ operating in the markets are very much aware of the emotions that drive YOU, and the uninformed traders or investors, in your trading.

Why do the members of the self-regulated Exchanges around the world like to keep true volume information away from you as far as possible? The reason is because they know how important it is in analyzing a market! The significance and importance of volume appears little understood by most non-professional traders. Perhaps this is because there is very little information and limited teaching available on this vital part of technical analysis. To use a chart without volume data is similar to buying an automobile without a gasoline tank.

Where volume is dealt with in other forms of technical analysis, it is often viewed in isolation, or averaged in some way across an extended timeframe. Analyzing volume, or price for that matter, is something that cannot be broken down into simple mathematical formulae. This is one of the reasons why there are so many technical indicators; some formulas work best for cyclic markets, some formulas are better for volatile situations, whilst others are better when prices are trending.

Some technical indicators attempt to combine volume and price movements together. This is a better way, but rest assured that this approach has its limitations too, because at times the market will go up on high volume, but can do exactly the same thing on low volume. Prices can suddenly go sideways, or even fall off, on exactly the same volume. So, there are obviously other factors at work.

Price and volume are intimately linked, and the interrelationship is a complex one, which is the reason Volume Spread Analysiswas developed in the first place.

The History of the Wyckoff Method and TradeGuider

Volume Spread Analysis was previously known as Wyckoff Volume Spread Analysis and has been in existence for over 20 years. Driven by an artificial intelligence engine, the TradeGuider  SMART VSA System  is unique and is capable of analyzing any liquid market in any time frame by extracting the information it needs in order to indicate imbalances of Supply and Demand evident in a chart. In doing so, TradeGuider is able to graphically exhibit the essential dynamics of market movement.

As mentioned earlier, this is not a new concept. Tom Williams, the inventor of VSA, is a former syndicate trader. He observed that the markets were being manipulated and that the key to unlocking the truth lay in the relationship shown in the Volume, the Spread of the bar, and its Closing Price.

Tom spent many years studying the concepts of Richard D Wyckoff, a renowned trader during the 1920’s and 1930’s. Richard  Wyckoff wrote several books about trading the Markets, and he eventually created the Stock Market Institute in Phoenix, Arizona. At its core, Wyckoff’s work is based on the analysis of trading ranges and determining when the stocks are in basing, markdown, distribution, or mark-up phases. Incorporated into these phases are ongoing shifts between ‘weak hands’, or public ownership, and ‘the composite operator’, now commonly known as “Smart Money”.

When Tom Williams went back to Beverly Hills in the early 1980’s, he began to investigate the possibility of computerizing the system he had learned as a syndicate trader- and so began the evolution of Volume Spread Analysis (VSA). With the assistance of an experienced computer programmer, Tom carefully studied thousands of charts to recognize the obvious patterns that were left when professional operators, or Smart Money, were active. This technique, although simple in concept, took several years to write and is now taught as a methodology in combination with software known as TradeGuider.

Here are three links to You Tube presentations that explain high probability, low risk trade set ups based on this method with actual charts and trade set ups explained. Also we include an interview with the Managing Director of Gibraltar Stock Exchange, Nick Cowan, a TradeGuider customer who explains his top two trade set ups and how and  why massive volume spikes on a price chart are an alert that a big move is setting up.

Video 1 – A high probability short Wyckoff / VSA trade set up explained

Video 2 – The importance of identifying climactic volume spikes before a trade set up.

Video 3 – Interview with Nick Cowan, former Global Head of Equities at ING Barings and a TradeGuider customer using Wyckoff VSA SMART technology.

To get a complimentary PDF copy of the book called “Trading in the Shadow of the Smart Money” by Gavin Holmes, please download from the front page of www.tradeguider.com.

If you have questions please email Laura Woodham-Holmes at our support desk at laura@tradeguider.com.

Further information is available at the following websites:

www.volumespreadanalysis.com

www.richardwyckoff.org

THE SPECIAL OFFER

As a thank you for reading our chapter and to find out more about the VSA methodology, click on the button below to watch a free video on our introductory course (valued at $197).

ABOUT THE AUTHOR

Author: Gavin Holmes
Company: Trade Guider
Websitewww.TradeGuider.com
Services Offered: Trading Education, Books, Videos, Trading Alerts
Markets Covered: Futures, Forex, Stocks

Gavin Holmes' passion is based on the original teachings of Richard Wyckoff, Richard Ney, and Tom Williams who all had the same goal, to educate the uninformed public.

Chapter
19

How to Read Order Flow for Unusual Options Activity

By Andrew Keene, AlphaShark.com

What are Options and Why Is Reading Order Flow Important? 

An option is a contract between the buyer and the seller.  There are two types of options: calls and puts.

Calls give the buyer the right, but not the obligation, to buy a specified stock or financial instrument (the ‘underlying’) at a specified price (the ‘strike price’) on or before a specific date (‘expiration’). The buyer has the right to buy the underlying at the strike price, and the seller has the obligation, but not the right, to sell the underlying should these conditions be met.

Puts give the buyer the right, but not the obligation, to sell the underlying at the strike price on or before expiration. Put buyers have the right, but not the obligation, to sell the underlying stock (or other instrument) at the strike price on or prior to expiration. Alternatively, put sellers are obligated to buy the underlying at the strike price should a buyer choose to exercise these rights.

So what factors determine how these options are priced? Six factors, or price inputs, determine an option ‘premium’:  the stock price, the strike price of the options, the time remaining until expiration, dividends, interest rates, and implied volatility.  In general, the more a given stock fluctuates in price on a daily or weekly basis, the more expensive its options will be, and vice versa. Options usually tend to be more expensive prior to earnings reports and other major announcements but decrease in price sharply after the announcement, once the “uncertainty’ has been removed. A good example of this is biotech stocks and drug announcements.

Options are traded for one of two reasons: as speculation or to hedge against a stock position.

Options are bought as speculation a stock will move in a certain direction. Calls may be purchased because a trader believes the stock will move higher prior to expiration.  Alternatively, puts may be purchased because a trader believes the stock will move lower prior to expiration.

The terms in-the-money, at-the-money, and out-of-the-money are used to describe the relationship of an option’s strike price to the price of the underlying stock. A call is in-the-money when the stock price is above the strike price. Alternatively, a call is out-of-the-money when the strike price is below the strike price. As you might guess, if a call is at-the-money, its strike price is equal to the stock price.

The inverse is true when looking at puts: if the strike price is above the strike price, a put is considered to be in-the-money. A put is out-of-the-money if the strike price is below the stock price, while the at-the-money definition is the same as for calls.

Options are also purchased to hedge against stock positions. Each day, I watch over 2,000 trades in real-time as they hit the tape. I always try to determine, are these orders a hedge against a stock position, or a speculative play? In the eleven years I spent trading on the floor, I learned how to “Read the Tape.” Most certainly a combination art and science, it is a skill I’ve honed over the years. A large part of my trading strategy is based on my ability to do this. By watching for big block option orders, dubbed ‘unusual options activity,’ I try to determine the positions of Paper. ‘Paper’ is term originating from the trading floor, when order were actually written on paper and run to traders in the pit by clerks. It is used to describe large institutions such as hedge funds, mutual funds, or large banks.  In other words, institutions who have access to better information – even ‘insider’ information’ – than your average trader or investor. When trading off of unusual option activity, I only want to take trades based on orders I believe to be speculative plays. Given the sensitive, and even illegal, natures of their positions, hedge funds tend to be a secretive bunch. Thus determining if these trades are speculative or a hedge is like piecing together a puzzle.

Let’s put it another way: what if you could have taken the same trades as Raj Rajatnam, or SAC Capital’s Steve Cohen, the moment they were put on? But I’d go to jail for insider trading, you might say? Not so fast.

The moment an order hits the tape, it becomes public information. I can trade off it, based on the fact that I believe someone placing such a large bet has access to insider information, and it is completely, 100% legal. This isn’t a matter of debate, or speculation, ask any SEC lawyer you know.  This is why I trade unusual options activity.  ​And this is why it works.

The Unusual Options Activity Trading Plan 

There is no ‘secret’ to becoming a profitable trader and you should be skeptical of anyone who tells you otherwise. That being aid, the techniques I’ve outlined in this text served me very well in my trading career and without them I would not have made the money I did.

Reading order flow and watching unusual options activity continues to be one of my most profitable techniques, just like it was on the trading floor. I had two very profitable years in Apple stock when my net profits in AAPL were over a million dollars. Once a week for a year, a Merrill Lynch broker would walk into the pit and sell AAPL put spreads.  His acronym was ‘HES,’ and whenever I would see him coming I would know to get long and sell volatility. How did he know? No clue, but by watching him I made quite a few profitable trades.

By combining order flow with technical indicators like the Ichimoku cloud, I devised my OCRRBTT trading plan to trade profitably off of the floor.

The OCRRBTT Trading Plan 

Pronounced “Oak Ribbit,” this trading plan will give you a step-by-step method for breaking down unusual option activity. After evaluating unusual trades with this plan you will be able to decide if you want to follow it or ignore the trade altogether. The letters in the acronym stand for open interest, chart, risk, reward, breakeven, time, and target. Here you will see the importance of each of these elements in the plan.

Open interest​: The first thing you need to look at is if the trade volume is bigger than the current open interest in that line. If it is this means that this is an opening position and is worth taking a look at. You don’t want to buy an option on unusual activity if it is really just paper covering a short. Only consider trades where volume is greater than open interest. 
 
Chart:​ This is the second most important element of the plan. Once an unusual order is confirmed to be an opening order you must then look at the chart of the underlying stock. You need to ask questions. Is the stock in a strong bullish or bearish trend? Is there support or resistance at the strikes the institution is trading? Is it more likely they are speculating on more upside or downside or could they be hedging? The answers to these questions will help you determine if the trade is speculation or a hedge. This will keep you from trading against the institution when you actually want to trade with them.

Risk, Reward, and Breakeven: ​Once the direction of the trade is determined you have to evaluate if the risk vs. reward profile of the trade the institution executed is in line with your risk tolerances.  Some trades they take could be far too risky for the average retail trader. However, since you know the direction the institution is betting you can tailor a trade that has the right risk setup for you. The risk of each trade must also be measured against the potential reward. If the institution is risking $5 to make $1 this is a trade you would want to avoid. You should also always be aware of the breakeven of each trade. If there is significant support or resistance at the breakeven point you may want to consider another strategy.

Time and Target:​ Always be aware of potential catalyst events that might be near. You want to know if paper is playing the overall direction of the stock or if they are playing a near term catalyst event like earnings, drug announcements, or new product launches. This might factor into your decision to take the trade or not. Once you have your time horizon set you want to pick a profit target. Are you leaving this trade on to expiration? Taking off half at a double and letting the rest ride? Knowing the answers to these questions on the onset of the trade make it easier to manage going forward. 

Putting the Plan to Work 

Once a trade hits the tap a trader must use the OCRRBTT trading plan to analyze the setup and determine if it represents an actionable trading opportunity. Let’s look at the example below and determine if it is a trade setup that we actually want to take. This order hit the tape on June 16​th 2015.


Before running this trade through the plan we need to understand the information we have. 

We are able to get a lot of information from order flow. We can see how many contracts this trader bought, that it was a $540,000 bet and that the trader that bought these options paid through the market makers offer to get filled. Although all of these things make this trade interesting they still do not necessarily qualify it as an actionable setup.

To make this determination we must evaluate this trade using the OCRRBTT Trading plan.  

Open Interest: ​Was this an opening position? This trade is labeled opening so there is no doubt it was an opening position. If for some reason the trade was not labeled opening we would still be able to confirm that it is because the volume of 5,000 contracts is greater than the current open interest in the line of only 796 contracts. With open interest smaller than volume there are not enough open contracts in the line for this to be a closing trade. It is confirmed opening.  

Chart: ​Does the chart indicate this trade is more likely to be a hedge or a speculative bet? We need to conform that the underlying trend of the stock supports this as a speculative bet. If it does not the trade may be a hedge and it is less likely to be actionable. To do this we will use an indicator called the Ichimoku Cloud. It may look intimidating but for this purpose a trader only needs to know that anything trading above the shaded area on the chart is in firm bullish territory and anything below it is in bearish territory.

Here is the chart of CAG on the Ichimoku Cloud the day these calls hit the tape:


We can see that the stock is trading above the Ichimoku Cloud and is an established bullish trend. This does not confirm with 100% certainty that this order was indeed a speculative bet but it makes it far more likely that this is the case. With the trend supporting the idea of this trade as a speculative bet we will move on to the next part of the analysis.  

Risk and Reward: ​Does the potential reward justify the risk? This is a very large trade in what is generally a boring stock. ConAgra (CAG) doesn’t usually get much unusual activity so if the risk and reward setup makes sense it might want to be a trade that we want to take. This is an outright call buy and a trader knows that they can never lose more than $1.08 in this trade. This translates to $108 in risk per one lot with what is a technically unlimited upside reward potential. This sets up for a good reward to risk setup and a trader can take this trade.  

Breakeven: ​Where is the breakeven point in this setup? These options are just out of the money and are being bought for $1.08. At that strike price that would make this traders upside breakeven $40.08, or about 4.6% higher than the stock’s price at the time of the trade. This is only a 4.6% move to the upside. That is not an unreasonable move. With that in mind the setup becomes even more attractive.  

Time and Target: ​What is the trader expecting? In this trade they are looking for a move to the upside of at least 4.6% by July expiration. Since the trader bought he Jul 39 calls we will buy the same ones. A trader should never trade a different expiration or price target than the institutional trader. Remember, they have better information than us.

Everything about this trade sets up well. All of the evaluations in the OCRRBTT trading plan point to this being an actionable trade setup.  

The Result 

This trade ended up being a fantastic winner. The trader’s motivations behind this trade become much more clear 3 days later when news breaks of activist activity in CAG.  

Look at how the stock responded to the news:

The stock gapped to the upside and these options exploded in value. Anyone looking at the reaction in the stock might be surprised by the huge move to the upside but for those paying attention to unusual options activity were alerted to this potential move 3 days before it actually happened.  

The options that the institutional trader bought saw an enormous move to the upside trading as high as $6.20 before expiration. This means that at the highs this trader would have profited $2.56 million dollars at the highs. Look at a chart of the options below. 

A retail trader who followed this trader with a 20 lot of these options would have profited $10,240 at the highs. This is a perfect example of how a retail trader can harness the power of institutional order flow and trade more like the biggest and most successful hedge fund managers in the world.

THE SPECIAL OFFER

How Can AlphaShark Trading Help Me? 

Since founding AlphaShark Trading in February 2012, I’ve been overwhelmed by the positive feedback and response I’ve received since. Business is booming, which is great, because I love helping traders improve their P&L through setting up better risk versus reward trades. Every day in the office, the other traders and I discuss strategies, options set-ups, and reasons why we did or didn’t take certain trades.

alphaShark trading began as a blog, but I realized I wasn’t just content with sharing my market commentary.  After all the monetary success options brought me, I wanted to help others ​stop losing money  at the very least.  

If you want to take a deeper dive, I would encourage you to click on the button below  watch this ​IMPORTANT VIDEO ​where I dive even deeper into the strategy.

ABOUT THE AUTHOR

Author: Andrew Keene, Founder & CEO
Company: Alpha Shark Trading
Website: AlphaShark.com
Services Offered: Trading Room, Market Scanners, Trading Education
Markets Covered: Stocks, Options, Futures, Currency pairs

Andrew’s first love will always be trading, but he is better known for building a trading room. He has taught his personal strategies to over 50,000 students over the past four years.