Intro

This eBook is designed to give you powerful methods and tactics for potential income creation in various markets.

InvestPub has leveraged its partnerships with educators and investors to provide the information presented in this eBook and we truly hope it is valuable and actionable as you pursue your investing goals.

With the partnerships comes a “Special Offer” or “Free Bonus” in each chapter that these partners have provided for you to take advantage of. We hope you’ll take advantage of those as well as the content within the eBook.

Chapter
01

“Smart Beta” - A Radical New Approach to Stock Screening

Dr. Mark Skousen, Eagle Publishing

A little more than a year ago, I launched a trading system with a unique strategy:

A system that screens stocks, but in a way that actually multiplies returns - while reducing risk! It all has to do with what's called a "beta multiplier."

For example, if a stock I'm screening has a score of 2, then that means the stock has a very clear chance of doubling the market. A score of 5 means you're multiplying returns by a factor of 5.

So, imagine having access to a stock screening system... with a beta multiplier of 15.2!

Let's take a look at how the system works, its background, and the results. First off, this system was strictly used as a beta program for three years. Over that time, it pinpointed 73 stocks considered "buys." 

Of those, 71 were winners. And the average gain (including losers) was 207%! (Keep in mind, that includes both stocks and options).

The system starts with 2,377 publicly traded companies, then analyzes more than 11,000 different data points.

What’s the goal of this analysis?

To find precisely 5 key characteristics that correlate with stocks that can skyrocket and produce the 15.2 beta multiplier I mentioned earlier.

At this point you're probably wondering what these 5 characteristics are, so let me share them now:

1. Sales growth over 11%

2. Profit margins over 12%

3. Price-to-earnings ratio under 29

4. Profit growth over 23%

5. Major institutional buying

Of course, this system is highly selective. It's not every day that stocks meet these rigid criteria. But here's what happens when they DO:

With this system, we've been able to record significant wins, to the tune of 424%... 180%... 130%... 168%... and countless more double-digit gains. In a recent run, my system hit on 14 profitable stock trades in a row, and nearly as many in a row on call options trades. Moreover, in 2016, my system suffered only 3 losses the entire year, and 78% of my call options made money.

What's more, the smart beta system works across all sectors. For a stock to be selected, it must match all criteria -- that's the driving force behind the system.

Here’s an example.  The system pinpointed Scotts Miracle-Gro, after reaching all 5 criteria.  With Scotts (NYSE: SMG) now green-lighted, I recommended the September $75 calls.

At that time, the Ohio-based manufacturer and seller of lawn and garden products had advanced 20% in five weeks… after J. P. Morgan upgraded the stock to “overweight.”

The lawn company has been using acquisitions to build a new business in the hydroponics market, which taps into marijuana demand.

I sold half the position for a 205% gain, a quarter position 15 days later for a 270% gain, and the final quarter three weeks later for a 1,016% gain. The average on all 3 gains was 426% over 40 days.

Another smart beta success story is InterDigital, Inc. (Nasdaq: IDCC), which develops and markets advanced digital wireless telecommunications systems. My system had repeatedly hit on only 3 or 4 of the needed 5 data points, but this time was different.

Profits continued as Wall Street analysts kept revising upward their quarterly earnings estimates from $0.82 cents a share to over $3.75.  With all 5 criteria met, my system locked in.  And we didn’t have to wait long to see the rewards.  We sold our March $87.50 call options in two parts, taking a 180% total gain, and holding for just 30 days.

Options aside, the system works the same way with stocks. 

When my system fired on all cylinders for Walker & Dunlop, Inc.(WD), we took a 27% gain after holding for 64 days. 

Here’s what the chart looks like:

Next it was Air Lease Corporation (AL).  The green light registered, and I recommended going long the stock.  It climbed more than 21% when I issued a sell alert, 93 days after recommending the stock. That chart looks like this:

THE SPECIAL OFFER


To learn more about the dynamics of the smart beta system, click the button below to continue reading.

ABOUT THE AUTHOR

Mark Skousen, Ph. D., editor of Forecasts & Strategies, is a nationally known investment expert, economist, university professor and author of more than 25 books. Currently, Skousen is a Presidential Fellow at Chapman University. He recently was named one of the 20 most influential living economists (superscholar.org).

He earned his Ph. D. in monetary economics at George Washington University in 1977. He has taught economics and finance at Columbia Business School, Columbia University, Barnard College, Mercy College, Rollins College and Chapman University. He also has been a consultant to IBM, Hutchinson Technology and other Fortune 500 companies.

Since 1980, Skousen has been editor in chief of Forecasts & Strategies, a popular award-winning investment newsletter. He also is editor of four trading services, Five Star Trader, High-Income Alert, Fast Money Alert, and 1600 Alert. In 1995, he served as editor of the investment series, “Secrets of the Great Investors,” with Louis Rukeyser as narrator.

Chapter
02

8 Forex “Life Hacks” To Make You a Better Trader

MarketTraders, Inc

Introduction:

Some of the most popular social media posts are the so-called “Life Hacks”.  These fun little strategies take the worry out of doing everyday chores and generally make life easier.

Just like you can use life hacks to make life easier, you can use strategies to make trading the Forex easier.

By sticking with these Forex Life Hacks, you increase your chances of Forex success:

Forex Life Hack 1: Memorize the Top Candlestick Formations

Every trader knows to watch the candlesticks, but how many know candlesticks enough to see their recurring patterns?  Few traders realize that candlesticks do more than show what the market is doing in that time frame, they also come together to create formations that expert traders can spot and use for profits.

There are a wide variety of candlesticks, and a lot of them have some pretty unique names, but there are a few that are important to remember:

Some candlestick formations to take note of are the Bullish Tweezer Bottom, the Bullish Piercing Line, the Bearish Engulfing Candle and the Bearish Shooting Star.  Each of these names gives an indication of the market direction and makes some connection between the candlestick and its wick.

Spotting these formations early allows you to get into the market right before a major move occurs, thus increasing your profit potential and allowing you to strike while the iron is hot.

Forex Life Hack 2: Stick to 2 or 3 Strategies...Max.

A phrase we like to use is “simplicity leads to pips”. When you come at the market with 20 different strategies, you end up stretching yourself too thin and you miss out on profits because you’re trying too hard. That’s why it’s important to limit the strategies you use to two or three at a max.

Why three?  It’s not because it’s a handy number, or one that translates easily.  It’s because there are three types of market movements, and it helps to have a strategy for each. You need a strategy for when you day trade, a strategy for when you are in a swing and/or a position trade, and one strategy for sideways movement.

Having three trusted strategies for each of these market conditions means that you should be more prepared to quickly review the market, whether the market is making for quick day trading movements, or is experiencing consolidation that spans ten or more days. You have something to analyze the conditions against, and the strategies to help you take advantage of these moves.

Forex Life Hack 3: Use Multiple Time Frames to Trade

The number one question new traders ask is what time frame they should trade within. The answer to this varies, but the bottom line is You should always be trading on more than one time frame!

How can this work?  It’s simple, time frames don’t work in a vacuum.  Each one has an effect on the other, and patterns that appear in long-term trades make appearances in short-term trades...and vice versa.

For example, if you’re looking to enter on the one-hour chart, you want to begin your analysis on at least the 4-hour chart or any larger time frame’s chart.

The rule is to always have your secondary, larger time frame be at least four times the size of your initial time frame.

Think of timeframes of having a parent-child relationship to each other.  The larger timeframes will have an effect on the smaller ones, much like parents have an effect on their children. The larger timeframe sets the scene for the smaller timeframes. Once you’ve established the overall direction of the market by the larger timeframes, you can trade the smaller timeframes for the specific entry and exit points.

A monthly time frame typically shows the next A-B-C-D formation for only the next 2,000 pips-worth of movement. The daily time frame shows the corresponding movements that create the larger A-B-C-D formation for the next 500 to 1,000 pips worth of market action.

The great thing about this method is that it solves the largest problem that faces many currency traders. That problem is knowing when to stop buying and when to start selling.

With the larger movement identified, traders can better determine when the market’s tides are preparing to change for a full movement in the other direction, as opposed to the natural wave-like movements that make up large market swings.

Forex Life Hack 3: Never Risk More than 2 - 5% of Your Account

A good piece of advice in life is to never risk more than you’re willing to lose. Whether you’re trading in the stock market or taking a mortgage out on your house, you should never put up more than you can live without. This is especially true when the thing you’re risking is money.

It’s worth mentioning again: You should NEVER risk more than you’re willing to lose.

The Ultimate Traders Package on Demand™ suggests never risking more than five percent of your account.

You have to understand, before going into the market, that every trade you might do comes with it some risk. There isn’t a trader in history that has a 100% winning percentage.  The fact of the matter is that you will lose at some point, but  when you manage your risk successfully you can take those losses and live to fight another day.

You also want to be able to put in enough money to make a profit.  After over 20 years of experience, we have figured out that the sweet spot between making money, and not going bankrupt when losing money, falls in the two to five percent range.

We recommend beginner or more risk-averse traders to start with risking only two percent of your current trading pool in every trade.  Once you become more experienced in the market, or your profits have risen enough, you can move to three, four, or the full five percent.

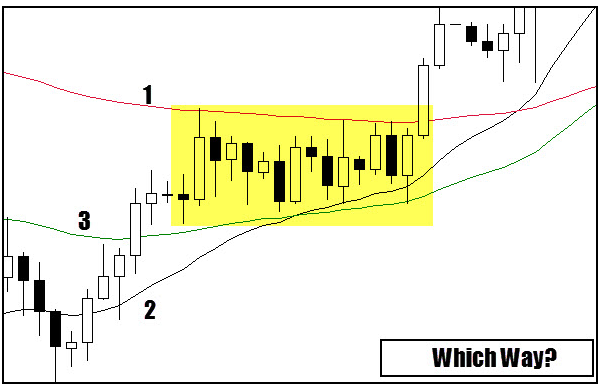
Forex Life Hack 4: Identifying and Trading the King’s Crown

One of the more famous, and often used, strategies is something called the Head and Shoulders pattern.  This happens when a bullish trending market makes a peak and begins to retract. The name comes from the picture the market makes as it peaks and valleys. The highest point is the head, and the two lows on either side of it are the shoulders.  In theory, you draw a “neckline” connecting the two shoulders and begin to trade at that point.

The problem is, the market will often overcorrect itself and you’ve taken a loss before you knew what hit you.  That’s why the FX Chief™  prefers to trade a different pattern: The King’s Crown.

The King’s Crown is trading beyond the “shoulders” of the Head and Shoulders pattern. Once the market takes out a low of support, it has a tendency to bounce back up and wave before the market finally falls. In this strategy, your stop would be taken out on that rally right before the market turned to complete your direction.

Basically, you aren’t trading the neckline, you are trading the breaking point beyond the lowest low. This extra spike in the market (turning the person in a crown) allows you to see the true indication of the markets and could lessen the chance you have of taking on losses in the future.

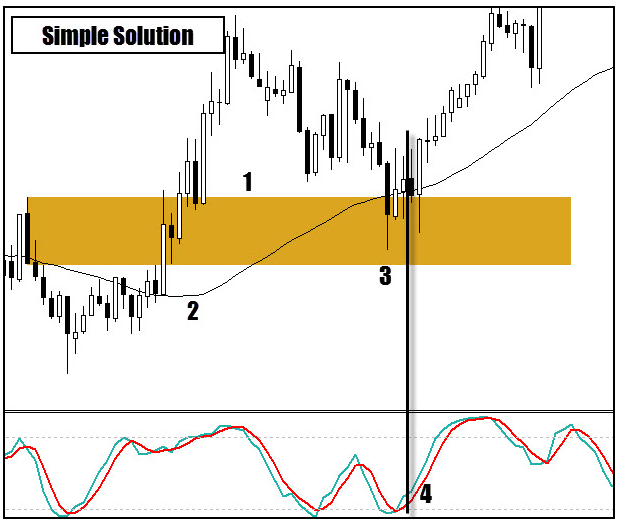
Forex Life Hack 5: Learn to Love the Stochastic RSI

Think of the ups and downs of the market as trends like in the fashion industry. Take leg warmers for instance. 

Back in the 80s leg warmers were very popular, they were used by a large segment of the population, and then once it hit a certain point it became TOO popular and there was a backlash created against it, making the trend slowly go away.

A lot of fashion manufacturers would have loved to have known when the trend was starting to go away. They would have wished they knew some kind of indicator.

There might not be an indicator like that for the fashion industry, but there is for the markets. It’s called the stochastic RSI, and it could be your key to trading.

The stochastic RSI is made up of two lines that serve as a sort of benchmark for when the market is looking to reverse.  If the stock is traded too high, it will break that line and begin to trend down. If the stock is going too low, it will break the bottom line and start trending back up.

Having a handle on the two barriers that the stochastic line makes up will give you a sense as to when you should reverse your direction and go from bull to bear, and vice versa.

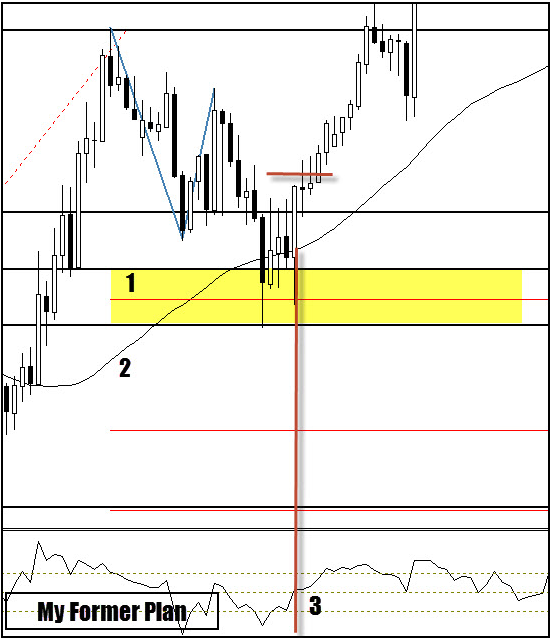
Forex Life Hack 6: Utilize Stop-Losses for Your Wins

How familiar does this sound?

You put in to the market and, like a good trader, you set your stop.  However, you find yourself constantly being taken out just before your big win.  It’s a common problem that has one easy solution

You need to change your stop-losses as the market changes!

As the market fluctuates, the stop losses grow larger in size. This volatility creates higher highs and higher lows, which can spell higher profits for smart traders.

And smart traders adjust their stop losses to mirror the market.

Traders make stop losses to prevent themselves from losing their entire account over the course of one trade.  By setting a minimum number for the market to hit, once the market hits that number, the trade is automatically ended and the loss is taken. The way to properly use a fluid stop-loss number is to move the minimum number in accordance with the market moves.

Let’s look at an example.

The chart below has several yellow circles. These circles represent the stop-loss price at different times in the trading timeframe.  Starting from the furthest left circle, you would adjust your stop-loss to match the next lowest number the market hits (which is the new yellow circle).

Even without the benefit of seeing the actual numbers, you can see the difference between the furthest left and the furthest right circle. This pip difference would be lost if you didn’t utilize a moving stop-loss number.

How do you know when to move your stop-loss?

It’s easy.  Look for a high or a low that has two candlesticks to the left, and two candlesticks to the right that are either higher or lower from that point.  A high will have two lows to the left and right, a low will have two highs to the left and right.

Forex Life Hack 7: Using Reversals to Your Advantage

Trading occurs in a 24-hour window consisting of three different trading sessions: European, U.S. and Asian sessions.  The European session has the most movement, followed by the U.S. and then the Asian markets. More often than not, the market will reverse directions when one session ends and the other begins. It’s by playing off this reversal that the most pips are captured.

It stands to reason that if the European session is trending bullish that once the American session kicks in, it will set up a reversal and the market will turn into a bear.

By utilizing this strategy you can pinpoint the reversal points, take advantage of the market movement, and identify when a market high and low will occur. With three trading sessions happening per day, there is the potential for 2 reversal points per day, which means that using only one strategy can dictate how you look at three different markets.

Forex Life Hack 8: Pinning Your Trading Personality

There are four distinct types of trading personalities.  Finding yours could be the key to trading your strengths and limiting your weaknesses. It’s rare for a new trader to know their personality, so read the explanations and see if there is one (or multiple) that describes you.

The Now Trader: The now trader wants to get in, get their pips, and get out.  They generally use smaller time-frames, spend less time per-day trading and capture smaller pip numbers. However, because they trade in such short timeframes, the Now Trader tends to trade more often and have more straightforward trading strategies.

The In-The-Game Trader: These traders love to check into the market daily, but prefer their action to be longer-lasting and tend to favor larger pip captures over a longer period of time. The daily trader often trades in the more mid-range timeframes and pays close attention to reversals and predictive fibs.

The Adrenaline Junkie Trader: These traders only trade once, or a couple times, per month based on major announcements such as quarterly or earnings reports.  They love the riskiness of the market and tend to trade for only a couple hours at a time, but they end up winning big if their strategies hold true.

The Low-Maintenance Trader: The ultimate set-it-and-forget-it trader.  They like to trade in the long-term by utilizing strategies that end up with big profits over many months.  They aren’t looking for the thrill of the high-risk maneuver, or the commitment of a daily trading schedule.  Rather, they are banking on safer picks that will benefit them in the future.

There is no right or wrong way of trading, there is potential to make money in all of them.  What matters as a trader isn’t when, or how often, you trade.  The key to successful trading is managing your risk, developing your strategy, and making smart decisions based on the charts.

Summary

Like any Forex tip, these can’t guarantee a win, and trading the Forex has an inherent risk involved.  However, these tips can provide some insight into the mindset of those who have successfully traded in the past.

Using the tips seen here along with sound risk management, having a secondary source of income is possible by trading the Foreign Exchange.

THE SPECIAL OFFER

Available for a limited time, get the #1 trading tool that I use to detect trade setups and access to trading strategies geared towards improving your consistency 100% free by visiting us here!

ABOUT THE AUTHOR

Before his days as an expert analyst and trader seen in Trader Planet's Digital Journal, Your Trading Edge and FX Street, Josh was your average guy before him became the Forex world's FX Pathfinder. He knew he wanted to do something he was passionate about for a living, but it seemed like nothing was working out.

Josh has made a name for himself with the London Daybreak strategy and trading feats such as doubling his trading account in a single month and earning $10,000 in 30 minutes with his personal trading strategies. As a course creator, mentor and active instructor with MTI, you can find Josh in MTI student classes, live training sessions and MTI's free workshop series that are open to the public.

Chapter
03

3 trading secrets you wish you knew years ago

Ace Trades

I have stumbled upon a simple trading system that has changed my life…

But it didn’t take me a few months or a year to figure out. What I have discovered that changed my life and the lives of many traders I teach has taken me over 50,000 hours of back testing and retesting to get the right recipe.

You see when I started out trading some 30+ years ago I relied on the word of my broker or resources like financial newsletters to help guide me through the markets. This strategy leads me down a dead-end road, and the only thing that was adding up in my account was the commission.

I knew this dream of making a living from day trading was real and I was prepared to take matters into my own hands.

I signed up for a weekend warrior course that kicked off my career as an investor. They taught me the ins and outs of trading with technical indicators. When it was all said and done they sent me home with a 100 page trading manual and a full stomach. As I woke up the following week excitement was flowing through my veins, my account was topped-off, and I was ready to apply my newfound knowledge. I was going to get rich!

Or so I thought. Some days, were amazing, I would make money and be the happiest trader in the world, confidence would radiate off me, as if I was truly a successful trader.

[eBook] Cracking the Chart Code

Discover the 3 reasons top traders use price action to master any market and the 5-step formula to master any market.

Just grab the eBook Here

Then there were those days I would lose, and lose big, sometimes thousands per day. Not long after that weekend warrior course my freshly topped-off trading account was back to zero for the second time. “Did I just get burnt again?” I thought.

And the worst part was that I had no one to guide me or answer any of my questions and no community that understood the process I was going through. It was a very lonely and very dark time in my trading career.

As most traders do, I went back for more. I went back to the drawing board and got serious: “I can figure this out” I told myself. I started back-testing the charts, getting rid of all the nasty indicators that fogged my brain and ultimately started unlearning all the bad habits I had cultivated. Some nights I would stay up until 3 AM back-testing my strategy. I would set the chart back a few years and then go forward bar by bar as if it was unfolding live. I was determined that I was going to become a professional at reading the charts through pure price action.

I literally spent 50,000 hours developing the best trading system on the planet.

It took me years to discover and perfect what I now know about the markets. But I have not been selfish and kept this information to myself. I have taught my discoveries to many deserving traders from all over the world. Some who have worked on trading floors and many who were brand new to the markets.

The financial industry can take its toll on you if you don’t have the right information.

I didn’t have the right information in the early days and it certainly took its toll on me but I didn’t give in.

With the thousands in losses came important lessons, and I want to share with you the crucial lessons I have learned so you don’t make the same mistakes.

I want to give you my new book called: The 3 reasons top traders use price action to master any market. Get it today absolutely free, consider it a gift from me to you because I know what’s it’s like to be lost with no direction. You need to know the truth about the markets and this book is 30 years of knowledge, heartache and my journey to success.

Don’t make the same mistakes I did. Instead, discover the secrets that helped me turn the ship around.

Below is a comment from a trader who was lost in indicators and trading jargon. After going through my content here is what they had to say.

I'm at 6 figures because of Ace Traders

"The Ace Methodology is the best I have ever seen and I Have been trading for over 25 years. The method used cannot compare to any system out there and I Tried them all.

"All I can say I took my account from a five-figure account to a six-figure account in my IRA. Thank You." - Stephen

ABOUT THE AUTHOR

Ace Trades is a market leader in teaching traders pure price action chart analysis. With over 30+ years’ experience in the financial markets, Ace will certainly change the way you look at your charts. Ace is also well known for hosting live market events that put the Ace Trades System on display. If you get a chance to attend a live market event be sure to see at least 250 in opportunity three days in a row.

Chapter
04

The 3 Most Powerful Day Trading Indicators

Netpicks

Day trading indicators are often touted as the holy grail of trading, but that is simply not true.

They are a useful trading tool that should be used in conjunction with a well-rounded trading plan but are not the plan itself.

Please note, as a reader of my chapter, you’re entitled to my full report: 8 Strategies for Trading with Indicators & Price Action to Create a Lifetime of Investing Income.

In this article I will cover:

  • The uses of trading indicators

  • Indicator selection

  • Two simple trading methods you can expand on

KEEPING TRADING SIMPLE

Whether you swing trade, day trade, or even position trade, too many trading indicators equals complexity which usually equals lack of consistency with trading decisions.

Information overload is often the result of traders finding a mix of day trading indicators potentially useful but in fact don’t really help in the trader making a profitable decision.

I have used trading tools in different combinations over the years, and there are three that I found to initially be the most useful day trading indicators for how I like to trade.

As time went on, simple became my mantra, and as a result, my trading decisions were clearer and were made with much less confusion and stress.

Grab the Income Indicators eBook

Learn 8 unique and powerful ways to trade with indicators and price action to help you generate an income for life.

We’ll show you the exact system and setups we use to generate high-probability opportunities.

Grab it Here

DAY TRADING INDICATORS GIVE INFORMATION ABOUT PRICE AND VOLUME

Almost every charting platform comes with a host of indicators that those who engage in technical trading may find useful. You simply apply any of them to your chart, and a mathematical calculation takes place taking into past price, current price and depending on the market, volume.

DIFFERENT TYPES OF TECHNICAL INDICATORS DO DIFFERENT THINGS:

  • Trend direction

  • Momentum or the lack of momentum in the market

  • Volatility for profit potential

  • Volume measures to see how popular the market is

The issue now becomes using the same types of indicators on the chart which basically gives you the same information. While this may be explained as looking for “trade confirmation“, what it really does is give you conflicting information as well as more information to process.

A simple example is having several trend indicators that show you the short term, medium term, and longer term trend. From a multiple time frame perspective, this may appear logical.

Many traders though can attest to seeing a perfectly valid setup negated because of a trend conflict and then watching the trade play itself out to profit.

Too much information can cause analysis paralysis which can keep you from making trading choices that are actually profitable ones.

breakout trading

Looking at just the trading range portion and price relation to the moving average, we have:

  1. Price below longer term average means short

  2. Price above medium term means long

  3. Price above short term means long

Not seen on this chart but the pivot black candle below #2 is actually a retrace into an area where a long trade was the call yet all trading indicators called to short at that time.

That is the main drawback with most trading indicators, and that is since they are derived from price, they lag price.

A trend indicator can be a useful addition to your day trading but be extremely careful of confusing a relatively simple trend concept.

Day Trading Question: Day trading involves quick decisions.

Would your trading be better served by simple or complex information gathering?

USEFUL TRADING INDICATOR SELECTION

Useful is subjective, but there are general guidelines you can use when seeking out useful indicators for your day trading.

One simple guideline is to choose one trend indicator such as a moving average and one momentum trading indicator such as the stochastic oscillator.

In order to explain how these can be useful as day trading indicators, take a look at this chart:

momentum and trend trading indicators
  1. In brief, this is a pivot area where price broke through and rallied hard away from the moving average

  2. Price starts to trade above moving average as well as slope of indicator is up and our plan says trend is up

  3. Price returns to the area marked #1 (also a complex ab=cd retrace)

  4. Momentum indicator crosses and turns up and we buy stop the high of the candle that turned it

Simple selection of trading indicators mixed with chart technicals can be the basis for your trading system.

DO TRADING INDICATORS WORK?

It all depends on how they are put together in the context of a trading plan. Some of the most used technical indicators such as moving averages, MACD, and CCI work in the sense that they do their job in calculating information.

THE POWER OF THE INDICATOR LIES IN HOW YOU INTERPRET THE INFORMATION AS PART OF AN OVERALL TRADE PLAN.

Don’t be sold on the “holy grail” indicator that marketers flood your inbox with. Proper usage of basic indicators against a well-tested trade plan through back testing, forward testing, and through demo trading is a solid route to take.

All of the systems that are offered by Netpicks not only come with tested trade plans but also hammer home that you must prove any trading system or trading indicator to yourself.

THREAT OF OVER-OPTIMIZATION

There is a downside when searching for day trading indicators that work for your style of trading and your plan.

Many systems that are sold use standard indicators that have been fine tuned to give the best results on past data. They package it up and then sell it without taking into account changes in market behavior.

The backbone of many trading systems are very mechanical in the sense that “if A happens, do B”.

There is nothing wrong with optimizing to take into account current market realities but your approach and mindset in doing so can either have you being realistic or over-optimizing out of the realm of reality.

One way you may choose to not fall into the over-optimizing trap is to simply use the standard settings for all trading indicators. This ensures you are not zeroing in on the most effective setting for the market of today without regard for tomorrow.

SMALL LIST OF USEFUL DAY TRADING INDICATORS

As I mentioned at the start of this article, there are three indicators which I personally have had great success with over the years and is how I started.

My trading as evolved as I began to understand other aspects of the trading but these are where I started:

  1. Fibonacci

  2. Moving averages

  3. CCI – Commodity Channel Index

For the sake of consistency, I am going to use the same chart as I previously did. This is a day trading/swing trading chart of 1 hour on a Forex pair.

fibonacci moving average cci
  1. This zone was determined once the swing high was in place. It is a combination of the Fibonacci retracement and Fibonacci expansion (used for symmetry)

  2. This is the moving average used for objective trend determination. A short term setting will give you faster trend changes with more whipsaw. A longer term setting can have you miss a large portion of the current move

  3. Once the CCI comes close to or crosses the 0 level, a buy stop is placed above the high.

You can see the trend is up and price has retraced into an area that I would be interested in taking a trade. Once price hits the area, there is a potential setup but a trade trigger is needed to get into the trade.

The commodity channel index plus price moving in the trade direction is the needed trigger.

I purposely left out exact rules and settings (hint – settings are standard) so you can design your own strategy using your current trading knowledge.

This exact setup is applicable to day trading, swing trading, and even position trading

To summarize:

  • Moving average – Determine trend and can be part of the process in triggering in a trade and momentum plays. (both not described in this trading article)

  • Fibonacci – Determine, in advance of price, zones I may be interested in for a setup and possible trigger. Can also be used for profit targets.

  • CCI – Used for trade triggers but does have many uses including trend determination.

DOES THE CHOICE OF TRADING INDICATORS CHANGE?

As you can see, this list gives the 3 most useful trading indicators for me at a certain point in my trading.

Times change and what was useful then may not be useful for me today.

Every trader will find something that speaks to them which will allow them to find a particular technical trading indicator useful. Whatever you find, the keys is to be consistent with it and try not to overload your charts and yourself with information.

Simple is usually best:

Determine trend – Determine setup – Determine trigger -Manage risk

Free Bonus Strategies from Mark just for Reading

ABOUT THE AUTHOR

Mark Soberman founded NetPicks in 1996. Mark started trading actively back in the 1980s while attending UCLA. His first trade was Johnson and Johnson calls. Without success, he went onto trading more stocks, options and then futures. After another unsuccessful futures trade, he started his search for the right combination of indicators, training and trade plans. That ultimately led to the founding of NetPicks.com which for 21 years has been dedicated to the education, training, and empowerment of active individual traders. Using Futures, Forex, Stocks & Options to fit each student best the mission has been to help people like yourself succeed in supplementing or replacing income through active trading.